public health

Mapping COVID-19

By Lauren Gardner, January 23, 2020

.embed-container {position: relative; padding-bottom: 80%; height: 0; max-width: 100%;} .embed-container iframe, .embed-container object, .embed-container iframe{position: absolute; top: 0; left: 0; width: 100%; height: 100%;} small{position: absolute; z-index: 40; bottom: 0; margin-bottom: -15px;}

Reference: Dong E, Du H, Gardner L. An interactive web-based dashboard to track COVID-19 in real time. Lancet Infect Dis; published online Feb 19. https://doi.org/10.1016/S1473-3099(20)30120-1.

Background

On December 31, 2019, the World Health Organization (WHO) was informed of an outbreak of “pneumonia of unknown cause” detected in Wuhan City, Hubei Province, China – the seventh-largest city in China with 11 million residents. As of January 23, there are over 800 cases of 2019-nCoV confirmed globally, including cases in at least 20 regions in China and nine countries/territories. The first reported infected individuals, some of whom showed symptoms as early as December 8, were discovered to be among stallholders from the Wuhan South China Seafood Market. Subsequently, the wet market was closed on Jan 1. The virus causing the outbreak was quickly determined to be a novel coronavirus. On January 10, gene sequencing further determined it to be the new Wuhan coronavirus, namely 2019-nCoV, a betacoronavirus, related to the Middle Eastern Respiratory Syndrome virus (MERS-CoV) and the Severe Acute Respiratory Syndrome virus (SARSCoV). However, the mortality and transmissibility of 2019-nCoV are still unknown, and likely to vary from those of the prior referenced coronaviruses.

Infected travelers (primarily air) are known to be responsible for introductions of the virus outside Wuhan. On Jan 13 Thailand reported the first international case outside China, while the first cases within China, but outside of Wuhan were reported on January 19, in Guangdong and Beijing. On January 20, China’s National Health Commission (NHC) confirmed that the coronavirus can be transmitted between humans. On the same day human infections with 2019-nCoV had also been confirmed in Japan and South Korea, and the following day cases in the U.S. and Taiwan were detected in travelers returning from Wuhan. On January 21 multiple provinces in China were also reporting new cases and infection was confirmed in 15 healthcare workers, with six fatalities reported. Additional travel cases have now been confirmed in Hong Kong, Macau, Singapore and Vietnam. On Jan 22, a WHO emergency committee convened to discuss whether the outbreak should be classified as a public health emergency of international concern (PHEIC) under International Health Regulations, but were initially undecided due to lack of information, before deciding against the declaration.

Of immediate concern is the risk of further transmission resulting from high travel volumes and mass gatherings in celebration of the Chinese New Year on January 24. In attempts to mitigate local transmission within China, unprecedented outbreak control strategies were implemented in (initially) three cities. On 23 January 2020, Wuhan suspended  all public transport and air travel (in and out of the city), placing all 11 million city residents under quarantine. On Jan 24, Huanggang and Ezhou, cities adjacent to Wuhan, will also be placed under a similar quarantine, with more cities in China now following suit. Further, many cities have canceled Chinese New Year celebrations.

As Wuhan is a major air transportation hub in central China, various measures have been taken on a global scale to mitigate international spread. Targeted airport screening of passengers traveling from Wuhan was initiated as early as January 1 in Hong Kong and Macau. Taiwan, Singapore and Thailand starting to screen arriving passengers on January 3. In the U.S., the CDC began entry screening of passengers on direct and connecting flights from Wuhan to the three main ports of entry on January 17, 2020, with Atlanta and Chicago soon to be added. On January 23 the U.S. CDC raised its travel notice for Wuhan, China, to the highest of three levels. Additional Pacific and Asian countries including Malaysia, Sri Lanka, Bangladesh and India are now also conducting targeted passenger screening at airports.

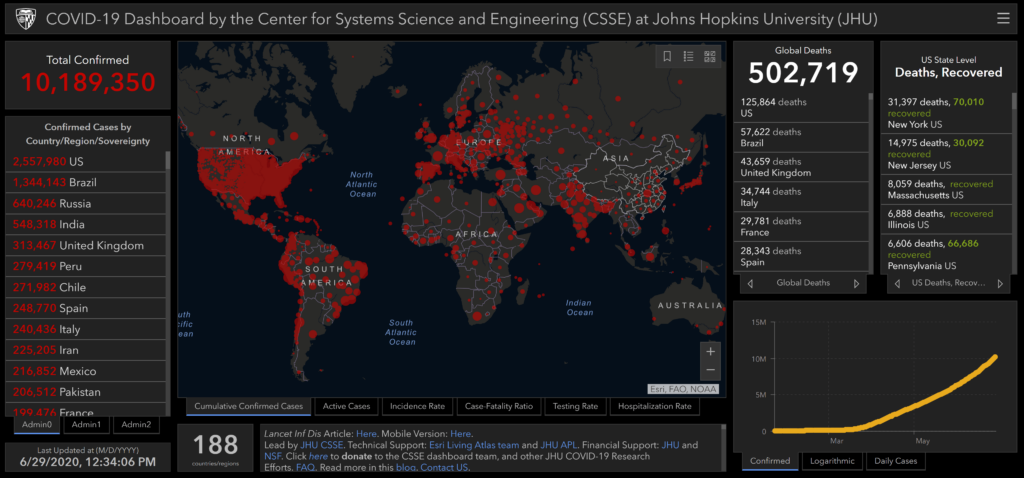
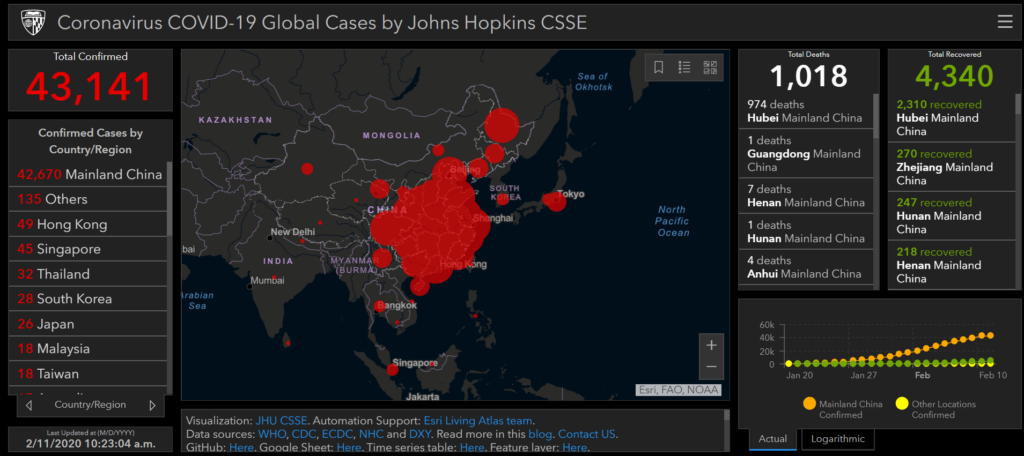
GIS Dashboard  (Updated April 27, 2020)

In response to this ongoing public health emergency, we developed an interactive web-based dashboard (static snapshot shown above) hosted by the Center for Systems Science and Engineering (CSSE) at Johns Hopkins University, to visualize and track reported cases in real-time. The dashboard, first shared publicly on January 22, illustrates the location and number of confirmed COVID-19 cases, deaths and recoveries for all affected countries. It was developed to provide researchers, public health authorities and the general public with a user-friendly tool to track the outbreak as it unfolds. Further, all the data collected and displayed is made freely available, initially as google sheets, now in a GitHub repository, along with the feature layers of the dashboard, which are now included in the ESRI Living Atlas.

The dashboard reports cases at the province level in China, county level in the US, state level in Australia and Canada, and at the country level otherwise. From January 22-31 the entire data collection and processing was managed manually. During this period the number of updates were typically conducted twice a day, both morning and night (Eastern Time). As the outbreak evolved, the manual reporting process became unsustainable, and on February 1, we adopted a semi-automated living data stream strategy. Our primary data source was initially DXY, an online platform run by members of the Chinese medical community, which aggregates local media and government reports to provide COVID-19 cumulative case totals in near real-time at the province level in China and country level otherwise. As the outbreak spread outside of China, the set of data sources providing the most reliable and timely case data evolved. We therefore regularly update, replace and supplement the set of data sources we rely on. Currently, DXY,remains the primary source of case data for all provinces in Mainland China, as well as Hong Kong, Macau and Taiwan. Additional data sources are relied upon for reporting on regions outside China.  These include U.S. county and state health departments, multiple national government health departments, as well as data aggregating websites including 1point3acres, Worldometers.info, BNO,and the COVID Tracking Project (testing and hospitalizations), which rely on a combination of reporting from local health departments and local media reports. The full list of sources is maintained on our CSSE COVID19 GitHub Repository. All dashboard data curation and updates are coordinated by a team at JHU.

Acknowledgements

Below is a list of the organizations supporting our Center’s COVID-19 mapping and modeling efforts. We are grateful for financial support from JHU, NSF, NIAID and NASA, Bloomberg Philanthropies, Stavros Niarchos Foundation, resource support from AWS, Slack and Github, and for technical support from Esri Living Atlas team and JHU APL.

Inverse optimization is an area of study where the purpose is to infer the unknown parameters of an optimization problem when a set of observations is available on the previous decisions made in the settings of the problem. We develop a framework to effectively and efficiently infer the cost vector of a linear optimization problem based on multiple observations on the decisions made previously. 

We then test our models in the setting of a diet problem on a data-set obtained from NHANES; The data-set is accessible via the link bellow:

https://github.com/CSSEHealthcare/Dietary-Behavior-Dataset

A set of female individuals with the above criteria were considered. Further demographic and diet considerations (in order to select similar patients) led to selecting 11 different individuals’ one day of intake as the initial dataset for the model. In another setting, we only considered people that have consumed a reasonable amount of sodium and water. We consider these two nutrients as the main constraints in the DASH diet. 


In order to compare different potential data and their performance with the model, we used different data groups from the NHANES database. A group of middle-aged women with certain similar characteristics and a group of people with certain attributes in their diets. In the first group, we did not consider how the individual’s daily diet is reflecting on the constraints that the forward problem had and we relied on their own personal answer to questions regarding hypertension and also how prone they thought they were to type-2 diabetes. The result was a sparse set of variables and an inconclusive optimal solution in regards to the preferences. In the second group, we tried to obtain sub-optimal data. We prioritized the maximum sodium intake constraint and the water intake constraints as our main and most important constraints. 

We introduce a new approach that combines inverse optimization with conventional data analytics to recover the utility function of a human operator. In this approach, a set of final decisions of the operator is observed. For instance, the final treatment plans that a clinician chose for a patient or the dietary choices that a patient made to control their disease while also considering her own personal preferences. Based on these observations, we develop a new framework that uses inverse optimization to infer how the operator prioritized different trade-offs to arrive at her decision. 

We develop a new inverse optimization framework to infer the constraint parameters of a linear (forward) optimization based on multiple observations of the system. The goal is to find a feasible region for the forward problem such that all given observations become feasible and the preferred observations become optimal. We explore the theoretical properties of the model and develop computationally efficient equivalent models. We consider an array of functions to capture various desirable properties of the inferred feasible region. We apply our method to radiation therapy treatment planning—a complex optimization problem in itself—to understand the clinical guidelines that in practice are used by oncologists. These guidelines (constraints) will standardize the practice, increase planning efficiency and automation, and make high-quality personalized treatment plans for cancer patients possible.

Assume that a decision-maker’s uncertain behavior is observed. We develop a an inverse optimization framework to impute an objective function that is robust against misspecifications of the behavior. In our model, instead of considering multiple data points, we consider an uncertainty set that encapsulates all possible realizations of the input data. We adopt this idea from robust optimization, which has been widely used for solving optimization problems with uncertain parameters. By bringing robust and inverse optimization together, we propose a robust inverse linear optimization model for uncertain input observations. We aim to find a cost vector for the underlying forward problem such that the associated error is minimized for the worst-case realization of the uncertainty in the observed solutions. That is, such a cost vector is robust in the sense that it protects against the worst misspecification of a decision-maker’s behavior. 

As an example, we consider a diet recommendation problem. Suppose we want to learn the diet patterns and preferences of a specific person and make personalized recommendations in the future. The person’s choice, even if restricted by nutritional and budgetary constraints, may be inconsistent and vary over time. Assuming the person’s behavior can be represented by an uncertainty set, it is important to find a cost vector that renders the worst-case behavior within the uncertainty set as close to optimal as possible. Note that the cost vector can have a general meaning and may be interpreted differently depending on the application (e.g., monetary cost, utility function, or preferences). Under such a cost vector, any non-worst-case diet will thus have a smaller deviation from optimality.  

Radiation therapy is frequently used in diagnosing patients with cancer. Currently, the planning of such treatments is typically done manually which is time-consuming and prone to human error. The new advancements in computational powers and treating units now allow for designing treatment plans automatically.

To design a high-quality treatment, we select the beams sizes, positions, and shapes using optimization models and approximation algorithms. The optimization models are designed to deliver an appropriate amount of dose to the tumor volume while simultaneously avoiding sensitive healthy tissues. In this project, we work on finding the best beam positions for the radiation focal points for Gamma Knife® Perfexion™, using quadratic programming and algorithms such as grassfire and sphere-packing.

In radiation therapy with continuous dose delivery for Gamma Knife® Perfexion™, the dose is delivered while the radiation machine is in movement, as oppose to the conventional step-and-shoot approach which requires the unit to stop before any radiation is delivered. Continuous delivery can increase dose homogeneity and decrease treatment time. To design inverse plans, we first find a path inside the tumor volume, along which the radiation is delivered, and then find the beam durations and shapes using a mixed-integer programming optimization (MIP) model. The MIP model considers various machine-constraints as well as clinical guidelines and constraints.

Perioperative services are one of the vital components of hospitals and any disruption in their operations can leave a downstream effect in the rest of the hospital. A large body of evidence links inefficiencies in perioperative throughput with adverse clinical outcomes. A regular delay in the operating room (OR), may lead to overcrowding in post-surgical units, and consequently, more overnight patients in the hospital. Conversely, an underutilization of OR is not only a waste of an expensive and high-demand resource, but it also means that other services who have a demand are not able to utilize OR. This mismatch in demand and utilization may, in turn, lead to hold-ups in the OR and cause further downstream utilization. We investigate the utilization of operating rooms by each service. The null hypothesis of this work is that the predicted utilization of the OR, i.e., the current block schedule, matches completely with the actual utilization of the service. We test this hypothesis for different utilization definitions, including physical and operational utilization and reject the null hypothesis. We further analyze why a mismatch may exist and how to optimize the schedule to improve patient flow in the hospital.

Primary care is an important piece in the healthcare system that affects the downstream medical care of patients heavily. There are specific challenges in primary care as healthcare shifts from fee-for-service to population health management and medical home, focuses on cost savings and integrates quality measures. We consider the primary care unit at a large academic center that is facing similar challenges. In this work we focus on the imbalance in workload, which is a growing regulatory burden and directly concerns any staff in primary care. It can result in missed opportunities to deliver better patient care or providing a good work-environment for the physicians and the staff. We consider the primary care unit at the large academic center and focus on their challenge in balancing staff time with quality of care through a redesign of their system. We employ optimization models to reschedule providers’ sessions to improve the patient flow, and through that, a more balanced work-level for the support staff. 

This work was performed with the MIT/MGH Collaboration.

In many healthcare services, care is provided continuously, however, the care providers, e.g., doctors and nurses, work in shifts that are discrete. Hence, hand-offs between care providers is inevitable. Hand-offs are generally thought to effect patient care, although it is often hard to quantify the effects due to reverse causal effects between patients’ duration of stay and the number of hand-off events. We use a natural randomized control experiment, induced by physicians’ schedules, in teaching general medicine teams. We employ statistical tools to show that between the two randomly assigned groups of patients, a subset who experiences hand-off experience a different length of stay compared to the other group.

This work was performed with the MIT/MGH Collaboration.

Many outpatient facilities with expensive resources, such as infusion and imaging centers, experience surge in their patient arrival at times and are under-utilization at other times. This pattern results in patient safety concerns, patient and staff dissatisfaction, and limitation in growth, among others. Scheduling practices is found to be one of the main contributors to this problem.

We developed a real-time scheduling framework to address the problem, specifically for infusion clinics. The algorithm assumes no knowledge of future appointments and does not change past appointments. Operational constraints are taken into account, and the algorithm can offer multiple choices to patients.

We generalize this framework to a new scheduling model and analyze its performance through competitive ratio. The resource utilization of the real-time algorithm is compared with an optimal algorithm, which knows the entire future. It can be proved that the competitive ratio of the scheduling algorithm is between 3/2 and 5/3 of an optimal algorithm.

This work was performed with the MIT/MGH Collaboration.

Tracking COVID-19

We are tracking the COVID-19 spread in real-time on our interactive dashboard with data available for download. We are also modeling the spread of the virus. Preliminary study results are discussed on our blog.