public health

Predicting COVID-19 Risk in the U.S.

By Maximilian Marshall and Lauren Gardner

September 3, 2020

Progression of COVID-19 in the US. The map illustrates the number of new weekly COVID-19 cases over time, and the graph tracks cumulative infections in the US.

Summary

In an effort to help governments and individuals with decision making related to the COVID-19 outbreak, the CSSE has developed a risk model at the county level for the United States. Using epidemiological data from our publicly available map and repository, along with anonymized mobile phone data, demographic and socioeconomic information, and various behavioral metrics, we are able to accurately assess the risk presented by COVID-19 in the United States at local, state, and national levels.

Motivation

COVID-19 presents an ongoing public health emergency. In the United States, government and societal responses to the virus have been inconsistent, both over time and in different regions within the US. Besides creating a turbulent and dangerous environment for viral transmission, these inconsistencies in policy and behavior have also made accurately anticipating the spread and effects of the disease difficult. The potential for asymptomatic transmission and a relatively long incubation and infectious period mean that behavior in the weeks prior play an important role in making effective epidemiological predictions for the future. Additionally, risk at a particular location is not just determined by the internal policies and behavior within that location; any other place that it is connected to by human mobility is also a potential source (or destination) of risk. For example, lax social distancing practices in one particular city (i.e. opening bars and restaurants for indoor use) could contribute to infections in multiple other parts of the US, depending on who visits that city and where they go after. Accurately capturing these factors and generating a robust analysis is complex and time-consuming, and many local and state governments are already resource-constrained by the health and economic effects of the virus. Given the broad range of decision makers and varying responses needed in the face of the rapidly evolving outbreak, we constructed our routine using a flexible approach that allows us to model different risk indicators for different use cases. While we believe that predicting absolute case numbers is valuable, we also believe that predicting events like case spikes in vulnerable places is extremely important. There is not a one size fits all metric to understand and respond to the danger that the COVID-19 presents. For example, weekly case growth is important for short-term distribution of hospital supplies, while longer-term predictions are more helpful for planning school reopening policy and vaccine distribution. Since different types of predictions are necessary, we developed a flexible modeling framework to synthesize the complex spatiotemporal dynamics of human behavior and viral transmission into accessible and accurate predictions at the local level. We continue to refine the model to both increase the accuracy of our predictions and infer the most important factors driving the outbreak. 

Methods

Our risk modeling framework uses an empirical, statistical methodology to forecast COVID-19 risk for the United States. We model several different aspects of the outbreak, including new cases and deaths over different time horizons, whether or not case and death curves will significantly deviate from current trends, case and death rates per person, risk categories based on time-dependent rates of change, and categorical epidemiological classifications. These examples demonstrate our modeling philosophy, and the value of our risk analysis. Our goal is to continue to develop the model to better identify at-risk populations and learn who and where people are most exposed to risk of infection and death from COVID-19.

An important input for our model is real-world mobility data. Each line in this figure represents a connection to a major urban area that we calculate was traveled by at minimum 500 people on August 1, 2020

Our forecasting model utilizes an empirical machine learning (ML) approach centered on a simple idea, that future viral infections are driven by how individuals respond to and spread the current outbreak, and future deaths are the result of the intersection of infections and vulnerable populations. We directly model this by using the real-time and time series data on COVID-19 infections and deaths from our dashboard, granular cell phone mobility data, and demographic information from the US census and other publicly available sources.  Our approach combines disparate data inputs into a meaningful predictive model using a combination of raw data and novel metrics generated in-house as inputs. We use different statistical methodologies, such as multiple linear regression, logistic regression, random forest regression/classification, and curve fitting, and are developing techniques to further improve predictive capabilities with ensemble approaches, input clustering, and deep learning. 

Risk Factors Considered

As referenced above, our methodology involves both synthesizing our own predictor variables and using raw data. An example of a synthesized variable is our mobility metric, which takes raw mobility numbers and generates a value that can be used as a proxy for social distancing. Other synthesized inputs, for example, combine mobility and case data to flag potential routes for viral spread and examine the intersection of rising cases and higher-age populations. We use different combinations of these inputs, as well as other raw data sources, depending on the particular analysis we perform.  We are also evaluating and hope to include additional behavioral variables in the near future, which would reflect individual decision making such as compliance with recommended social distancing policies, mask usage, and hand washing. We believe capturing this behavior is an important part of understanding the outbreak, but want to ensure that available information meets our data standards before we include it in the model. Information on our current input data is included below.

Epidemiology Data
COVID-19 case and death data are taken from the JHU CSSE COVID-19 dashboard, which includes outbreak information at the county level, updated daily, starting on January 22, 2020.
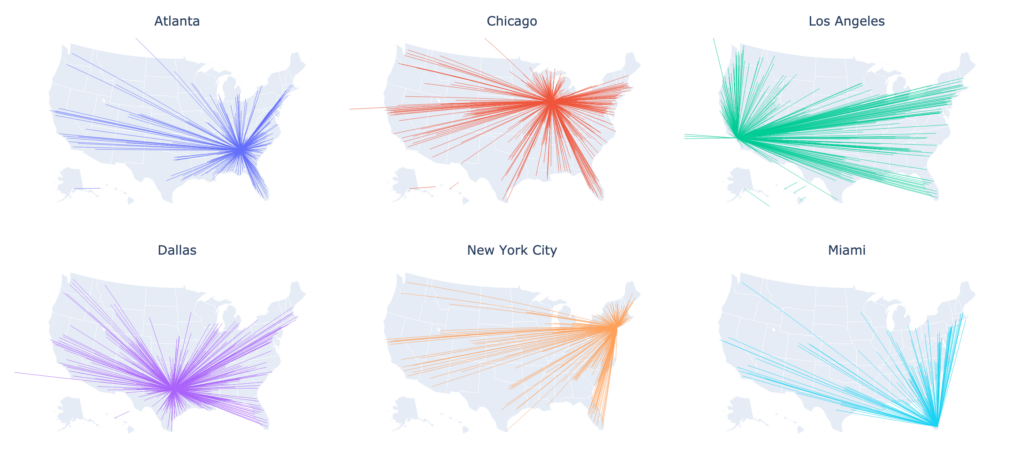
Mobility Data
We use anonymized mobile phone location data from SafeGraph to capture human mobility and generate metrics related to the likelihood of viral spread. Mobility counts are cleaned and normalized to represent population-level movements as closely as possible.

Population and Health Indicators
We gather this information from several publicly available sources. Population totals, demographic percentages, and age breakdowns come from the US Census. Health and economic measurements such as smoking percentages, poverty, and chronic disease are sourced from County Health Rankings. Statistics on hospital beds and availability come from the Definitive Healthcare Dataset published by ESRI. We are actively pursuing and testing additional population health metrics, both to improve predictions and enhance our ability to explain outbreak dynamics.

Example Outputs

The maps below demonstrate the output of a model run that predicts risk categories based on how many new cases will appear in each county in the US. This specific example displays the predicted risk category for the first two weeks of August, and the actual categories from observed data.

Comparison of projected quantiles of new cases in each county during the first two weeks of August 2020 (output from the model), compared to observed cases reported.

Acknowledgements

Below is a list of the organizations supporting our COVID-19 modeling efforts. We are grateful for financial support from NSF, NIAID and NASA.

Inverse optimization is an area of study where the purpose is to infer the unknown parameters of an optimization problem when a set of observations is available on the previous decisions made in the settings of the problem. We develop a framework to effectively and efficiently infer the cost vector of a linear optimization problem based on multiple observations on the decisions made previously. 

We then test our models in the setting of a diet problem on a data-set obtained from NHANES; The data-set is accessible via the link bellow:

https://github.com/CSSEHealthcare/Dietary-Behavior-Dataset

A set of female individuals with the above criteria were considered. Further demographic and diet considerations (in order to select similar patients) led to selecting 11 different individuals’ one day of intake as the initial dataset for the model. In another setting, we only considered people that have consumed a reasonable amount of sodium and water. We consider these two nutrients as the main constraints in the DASH diet. 


In order to compare different potential data and their performance with the model, we used different data groups from the NHANES database. A group of middle-aged women with certain similar characteristics and a group of people with certain attributes in their diets. In the first group, we did not consider how the individual’s daily diet is reflecting on the constraints that the forward problem had and we relied on their own personal answer to questions regarding hypertension and also how prone they thought they were to type-2 diabetes. The result was a sparse set of variables and an inconclusive optimal solution in regards to the preferences. In the second group, we tried to obtain sub-optimal data. We prioritized the maximum sodium intake constraint and the water intake constraints as our main and most important constraints. 

We introduce a new approach that combines inverse optimization with conventional data analytics to recover the utility function of a human operator. In this approach, a set of final decisions of the operator is observed. For instance, the final treatment plans that a clinician chose for a patient or the dietary choices that a patient made to control their disease while also considering her own personal preferences. Based on these observations, we develop a new framework that uses inverse optimization to infer how the operator prioritized different trade-offs to arrive at her decision. 

We develop a new inverse optimization framework to infer the constraint parameters of a linear (forward) optimization based on multiple observations of the system. The goal is to find a feasible region for the forward problem such that all given observations become feasible and the preferred observations become optimal. We explore the theoretical properties of the model and develop computationally efficient equivalent models. We consider an array of functions to capture various desirable properties of the inferred feasible region. We apply our method to radiation therapy treatment planning—a complex optimization problem in itself—to understand the clinical guidelines that in practice are used by oncologists. These guidelines (constraints) will standardize the practice, increase planning efficiency and automation, and make high-quality personalized treatment plans for cancer patients possible.

Assume that a decision-maker’s uncertain behavior is observed. We develop a an inverse optimization framework to impute an objective function that is robust against misspecifications of the behavior. In our model, instead of considering multiple data points, we consider an uncertainty set that encapsulates all possible realizations of the input data. We adopt this idea from robust optimization, which has been widely used for solving optimization problems with uncertain parameters. By bringing robust and inverse optimization together, we propose a robust inverse linear optimization model for uncertain input observations. We aim to find a cost vector for the underlying forward problem such that the associated error is minimized for the worst-case realization of the uncertainty in the observed solutions. That is, such a cost vector is robust in the sense that it protects against the worst misspecification of a decision-maker’s behavior. 

As an example, we consider a diet recommendation problem. Suppose we want to learn the diet patterns and preferences of a specific person and make personalized recommendations in the future. The person’s choice, even if restricted by nutritional and budgetary constraints, may be inconsistent and vary over time. Assuming the person’s behavior can be represented by an uncertainty set, it is important to find a cost vector that renders the worst-case behavior within the uncertainty set as close to optimal as possible. Note that the cost vector can have a general meaning and may be interpreted differently depending on the application (e.g., monetary cost, utility function, or preferences). Under such a cost vector, any non-worst-case diet will thus have a smaller deviation from optimality.  

Radiation therapy is frequently used in diagnosing patients with cancer. Currently, the planning of such treatments is typically done manually which is time-consuming and prone to human error. The new advancements in computational powers and treating units now allow for designing treatment plans automatically.

To design a high-quality treatment, we select the beams sizes, positions, and shapes using optimization models and approximation algorithms. The optimization models are designed to deliver an appropriate amount of dose to the tumor volume while simultaneously avoiding sensitive healthy tissues. In this project, we work on finding the best beam positions for the radiation focal points for Gamma Knife® Perfexion™, using quadratic programming and algorithms such as grassfire and sphere-packing.

In radiation therapy with continuous dose delivery for Gamma Knife® Perfexion™, the dose is delivered while the radiation machine is in movement, as oppose to the conventional step-and-shoot approach which requires the unit to stop before any radiation is delivered. Continuous delivery can increase dose homogeneity and decrease treatment time. To design inverse plans, we first find a path inside the tumor volume, along which the radiation is delivered, and then find the beam durations and shapes using a mixed-integer programming optimization (MIP) model. The MIP model considers various machine-constraints as well as clinical guidelines and constraints.

Perioperative services are one of the vital components of hospitals and any disruption in their operations can leave a downstream effect in the rest of the hospital. A large body of evidence links inefficiencies in perioperative throughput with adverse clinical outcomes. A regular delay in the operating room (OR), may lead to overcrowding in post-surgical units, and consequently, more overnight patients in the hospital. Conversely, an underutilization of OR is not only a waste of an expensive and high-demand resource, but it also means that other services who have a demand are not able to utilize OR. This mismatch in demand and utilization may, in turn, lead to hold-ups in the OR and cause further downstream utilization. We investigate the utilization of operating rooms by each service. The null hypothesis of this work is that the predicted utilization of the OR, i.e., the current block schedule, matches completely with the actual utilization of the service. We test this hypothesis for different utilization definitions, including physical and operational utilization and reject the null hypothesis. We further analyze why a mismatch may exist and how to optimize the schedule to improve patient flow in the hospital.

Primary care is an important piece in the healthcare system that affects the downstream medical care of patients heavily. There are specific challenges in primary care as healthcare shifts from fee-for-service to population health management and medical home, focuses on cost savings and integrates quality measures. We consider the primary care unit at a large academic center that is facing similar challenges. In this work we focus on the imbalance in workload, which is a growing regulatory burden and directly concerns any staff in primary care. It can result in missed opportunities to deliver better patient care or providing a good work-environment for the physicians and the staff. We consider the primary care unit at the large academic center and focus on their challenge in balancing staff time with quality of care through a redesign of their system. We employ optimization models to reschedule providers’ sessions to improve the patient flow, and through that, a more balanced work-level for the support staff. 

This work was performed with the MIT/MGH Collaboration.

In many healthcare services, care is provided continuously, however, the care providers, e.g., doctors and nurses, work in shifts that are discrete. Hence, hand-offs between care providers is inevitable. Hand-offs are generally thought to effect patient care, although it is often hard to quantify the effects due to reverse causal effects between patients’ duration of stay and the number of hand-off events. We use a natural randomized control experiment, induced by physicians’ schedules, in teaching general medicine teams. We employ statistical tools to show that between the two randomly assigned groups of patients, a subset who experiences hand-off experience a different length of stay compared to the other group.

This work was performed with the MIT/MGH Collaboration.

Many outpatient facilities with expensive resources, such as infusion and imaging centers, experience surge in their patient arrival at times and are under-utilization at other times. This pattern results in patient safety concerns, patient and staff dissatisfaction, and limitation in growth, among others. Scheduling practices is found to be one of the main contributors to this problem.

We developed a real-time scheduling framework to address the problem, specifically for infusion clinics. The algorithm assumes no knowledge of future appointments and does not change past appointments. Operational constraints are taken into account, and the algorithm can offer multiple choices to patients.

We generalize this framework to a new scheduling model and analyze its performance through competitive ratio. The resource utilization of the real-time algorithm is compared with an optimal algorithm, which knows the entire future. It can be proved that the competitive ratio of the scheduling algorithm is between 3/2 and 5/3 of an optimal algorithm.

This work was performed with the MIT/MGH Collaboration.

Tracking COVID-19

We are tracking the COVID-19 spread in real-time on our interactive dashboard with data available for download. We are also modeling the spread of the virus. Preliminary study results are discussed on our blog.