Modeling COVID-19 risk in New Orleans due to workplace exposure
Maximilian Marshall, Sonia Jindal, and Lauren Gardner
June 28, 2021
Summary
Throughout the COVID-19 pandemic, state and local governments have had to make critical decisions regarding the timing and logistics of lockdown measures. When making such decisions, it is important that they have detailed information regarding the risks posed to the populations they serve. For this reason, in partnership with the city of New Orleans, CSSE created a model that maps COVID-19 risk from workplaces to residences. This model estimates the risk of exposure to COVID-19 infection in each type of workplace and calculates how much risk exposed workers take home with them based on their commuting patterns and residential locations. This way, we can aggregate the risk that workers bring back to their home locations throughout the city and understand how opening various districts and job sectors will affect exposure. The model calculates the risk due to workplace exposure at the census tract level in three steps: estimating infection risk at each tract, simulating commuting patterns, and mapping risk from workplaces to residences. The resulting risk estimates are used to create a heat map of how much risk is brought home to each area of the city from each occupational category and location. Importantly, this model does not reflect overall COVID-19 risk. Instead, since policy makers must weigh health benefits of keeping people at home against the economic effects of limited business, this model focuses on the risk of exposure at work and where workers take that risk when they go home.
Methodology
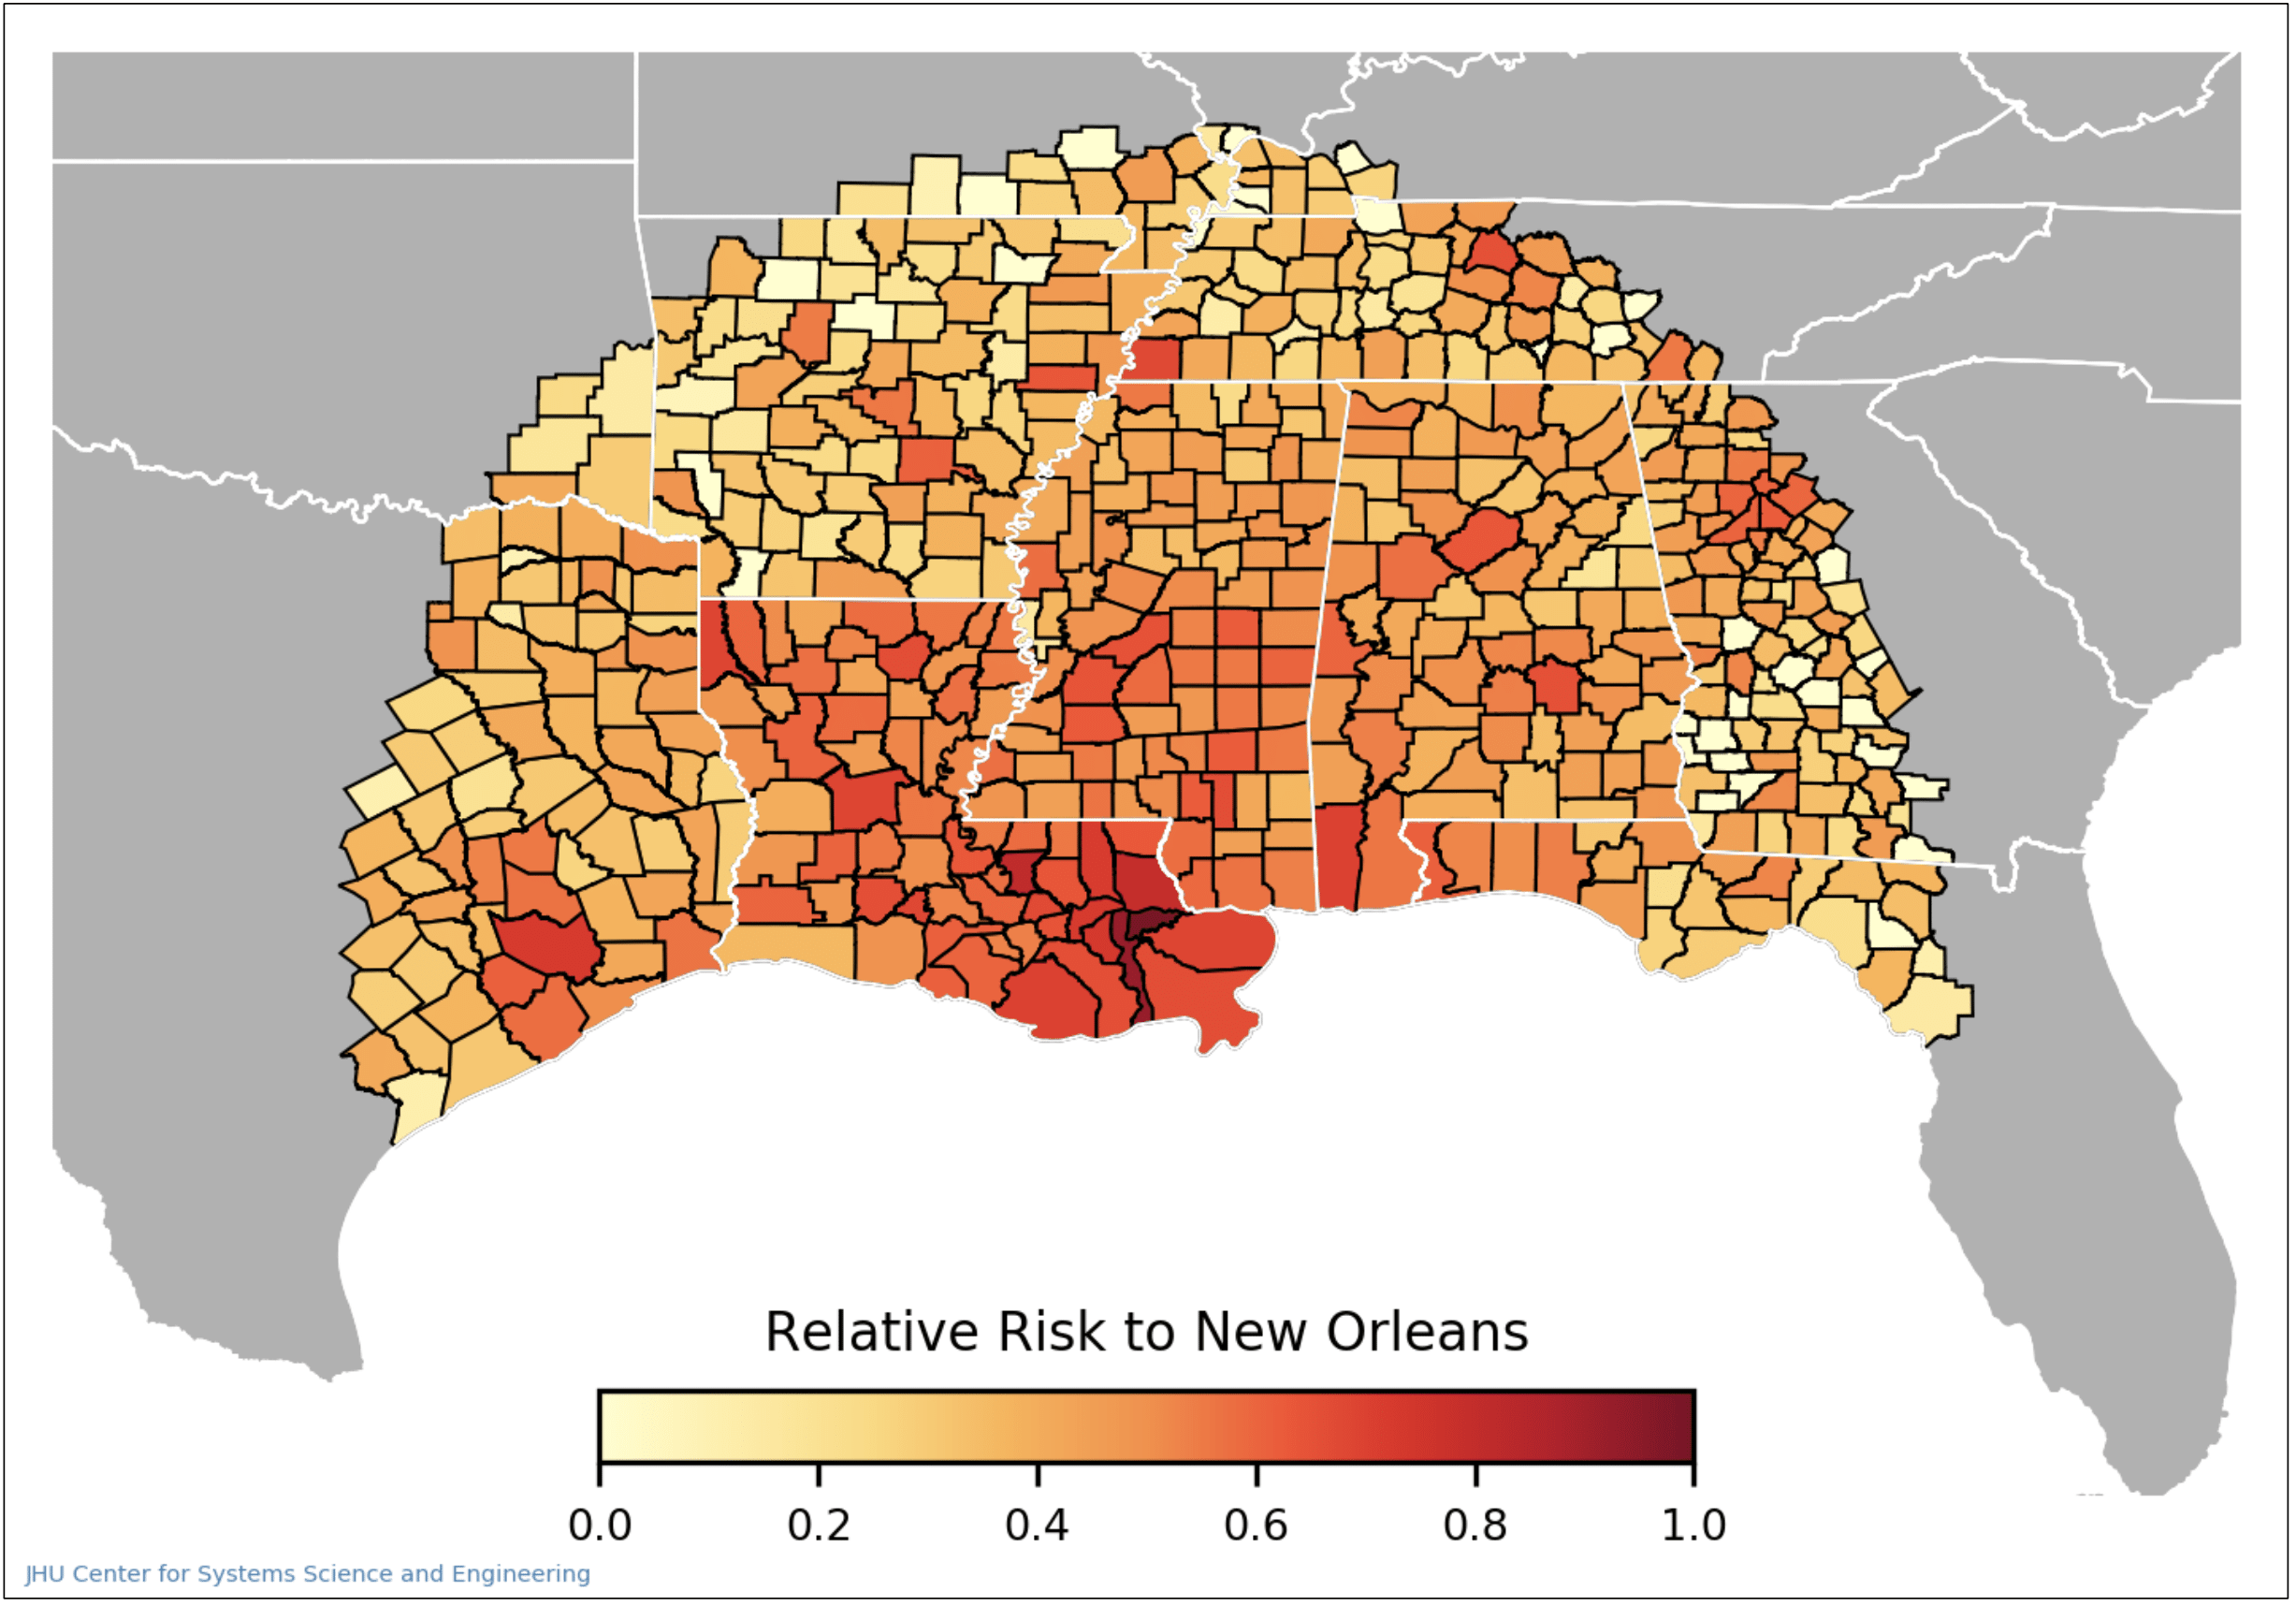
To calculate how high the risk of exposure to COVID-19 is for each tract in the city, the model calculates an estimate of how many infected people visit that tract. We estimate this using cellular phone mobility data by looking at trips to New Orleans for a multi-week span preceding the date of interest. County-level case data from the CSSE COVID-19 Dashboard is used to weigh the risk brought by each trip to New Orleans using the proportion of new cases to the population (case incidence) at the origin of the trip. The total workplace risk to a tract is the summation of the risk brought by each trip to that tract over the 14-day period being studied.
Example of county-level travel risk to New Orleans. Note that this example (for clarity) only shows counties within a 500-mile radius of New Orleans, while the model uses the entire United States.
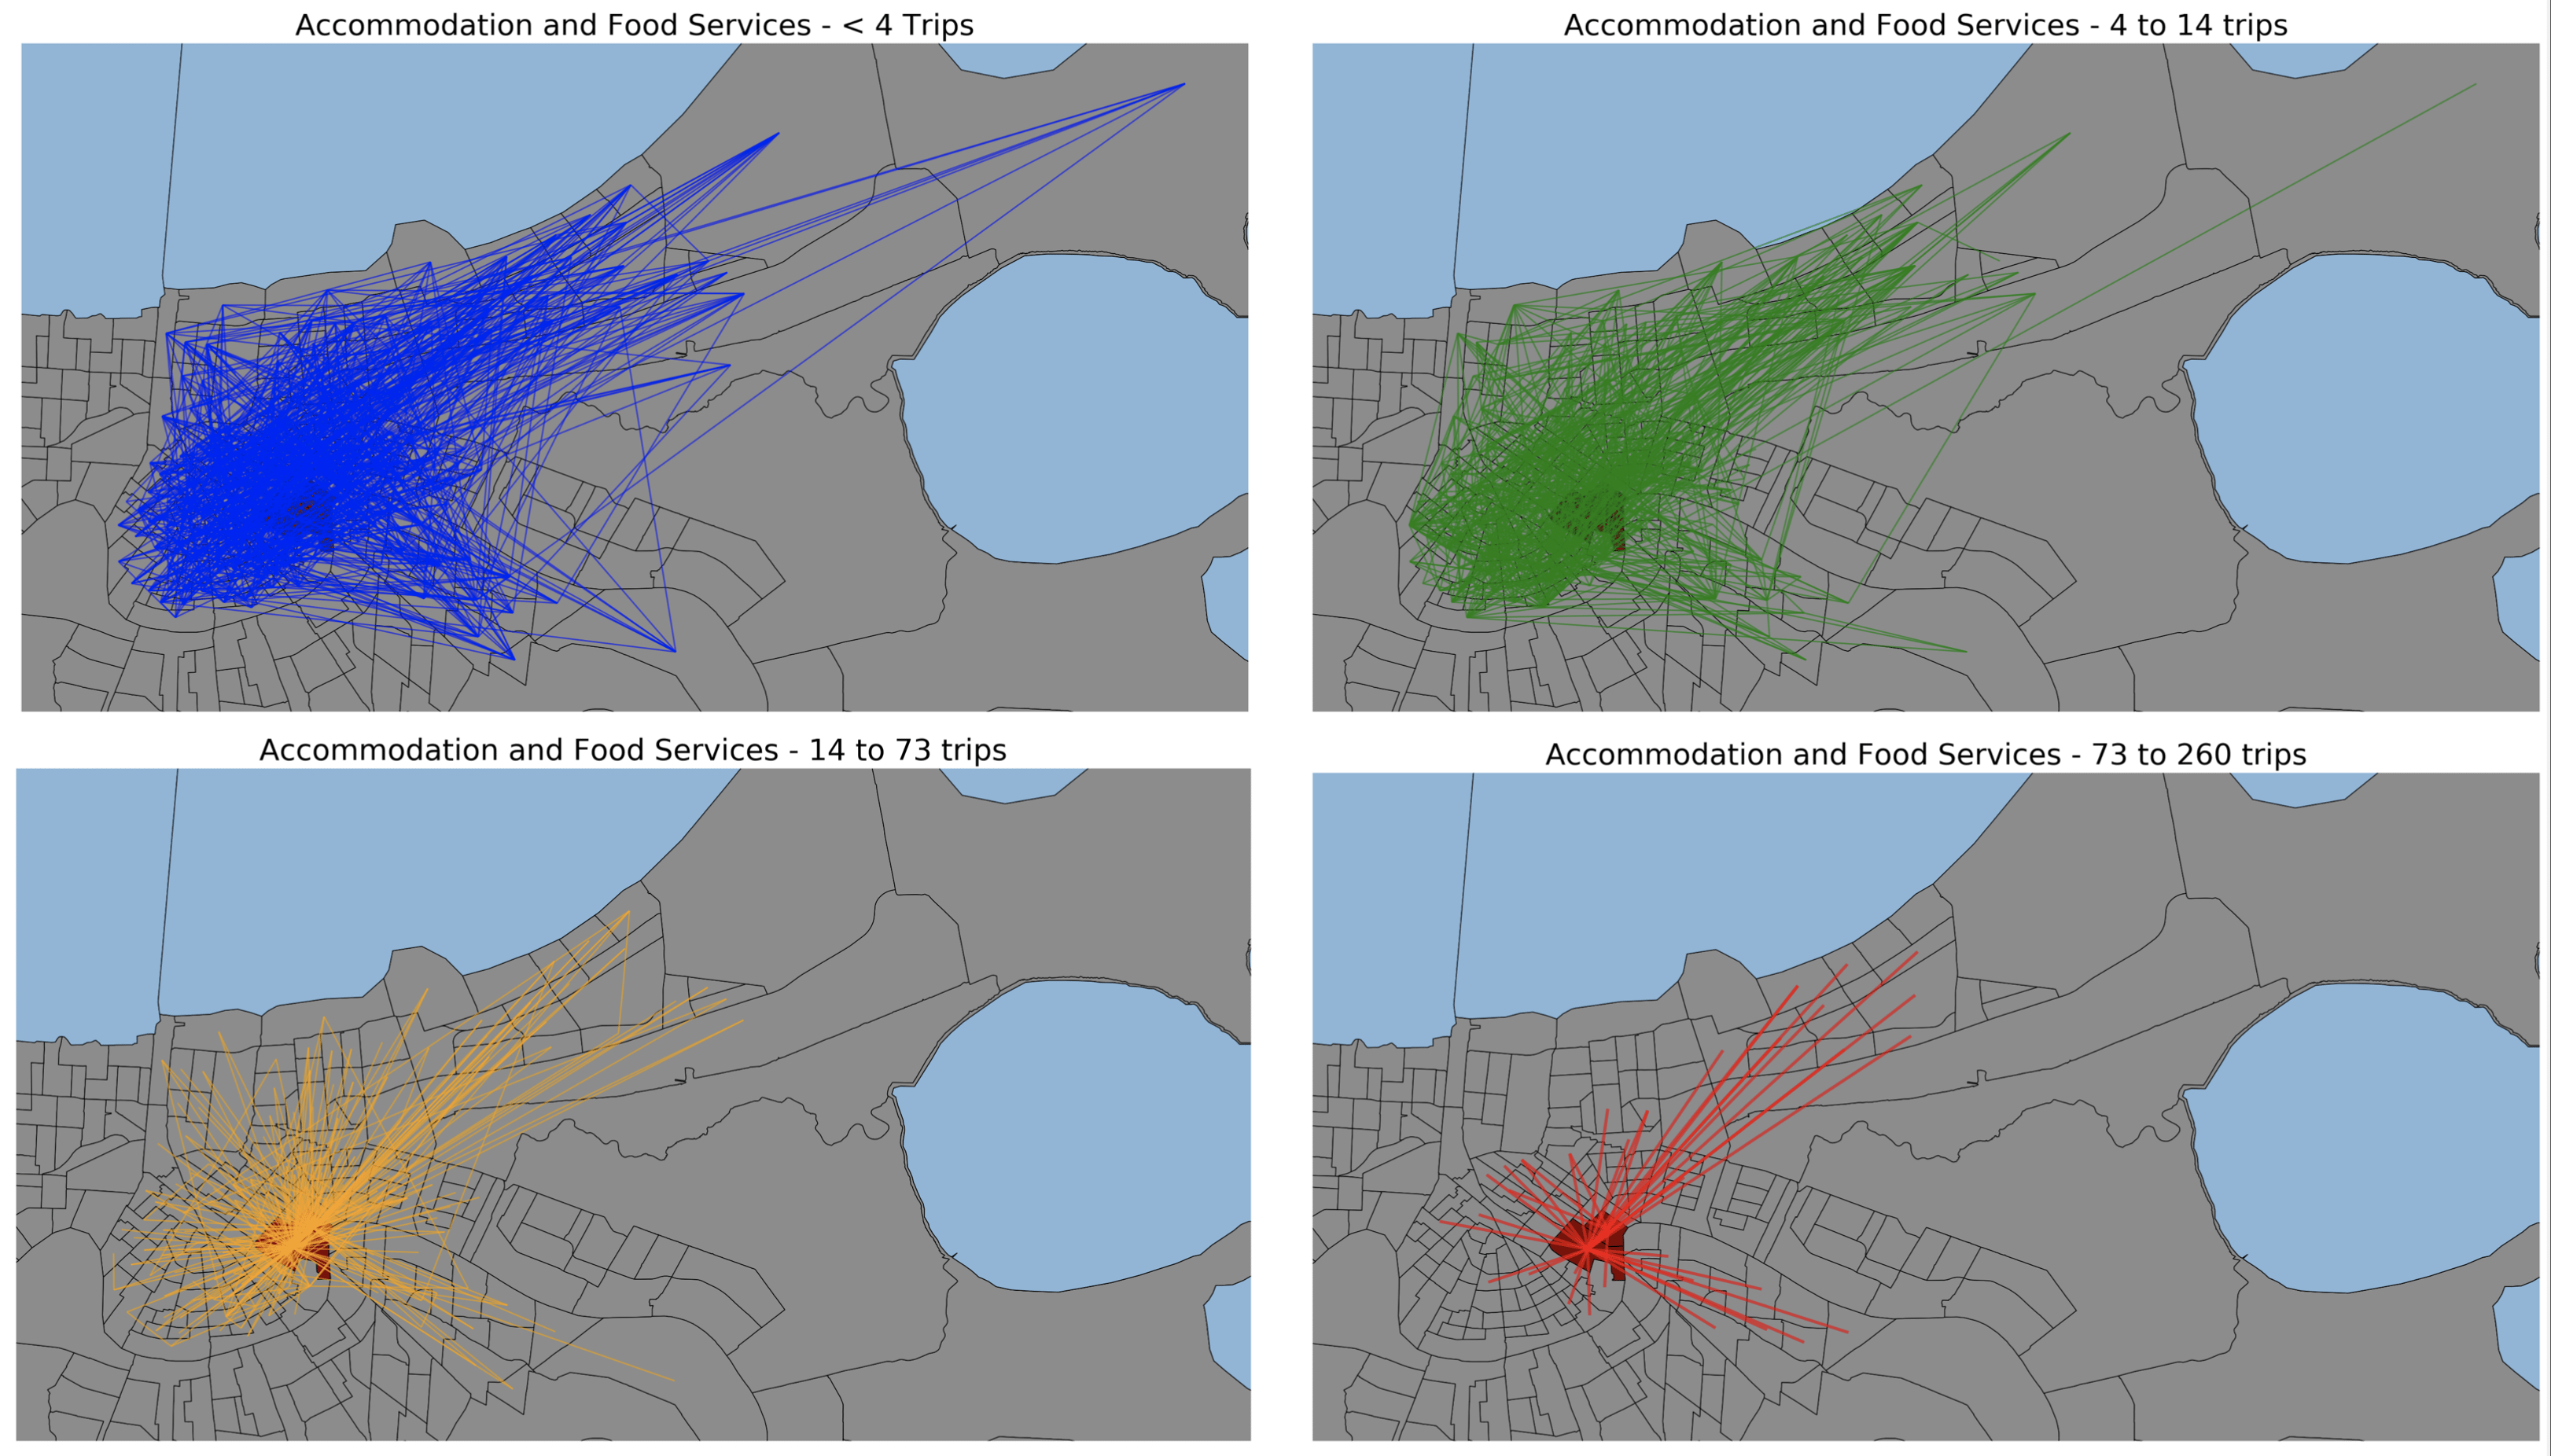
The second step of the model provides the necessary information to link exposure risk in the workplace to the risk brought home by workers. In order to make this connection, two elements must be simulated – the first is the commuting travel patterns of workers broken down by occupational category, and the second is the relative risk of infection for each category. As there are no existing datasets that comprehensively map commuting patterns with specific origin-destination linkages in New Orleans by job type, we use an optimization model to generate commuting flows by job category. The US Bureau of Labor Statistics (BLS) provides data of the number of people who work and live in each census block group, along with the job category of these residents and workers. Additionally, the BLS provides data on commuting flows between block groups but does not distinguish between the job categories of the commuters. Our optimization routine uses this data and assigns each commuting flow a job category, with an objective of minimizing the total distance traveled. The model’s occupational categorizations are constrained such that flow patterns between tracts are exactly matched. Additionally, residential and workplace totals are respected. The result of the optimization is a highly detailed set of commuter flows between tracts, broken down by occupational category.
Example commuting flows for a single occupational category. These outputs are divided into quartiles, so even though there are many fewer red lines than blue, the red lines represent the same number of people moving to and from work. Note that the higher-volume flows tend to cluster around the French Quarter/Central Business District (maroon area).
Lastly, the model uses the results from steps one and two in order to route the risk of infection from workplaces to residences. Workplace risk, as calculated in step one, is routed back along these flow paths using the metrics from step two. It is scaled by the number of people that make the commute, the relative level of proximity to others for each occupation (proximity data provided by O*NET, the Occupational Information Network, developed under the U.S. Department of Labor), and the average household size of the residential tract. Each of these streams of risk flowing back from workplaces to residences is summed to yield the residential risk for each census tract. In this step, the model user can also input reopening levels for each occupational category to understand what the effects on risk will be. This reopening factor is used to scale the results at each tract by multiplying the risk for each occupational sector by the reopening level.
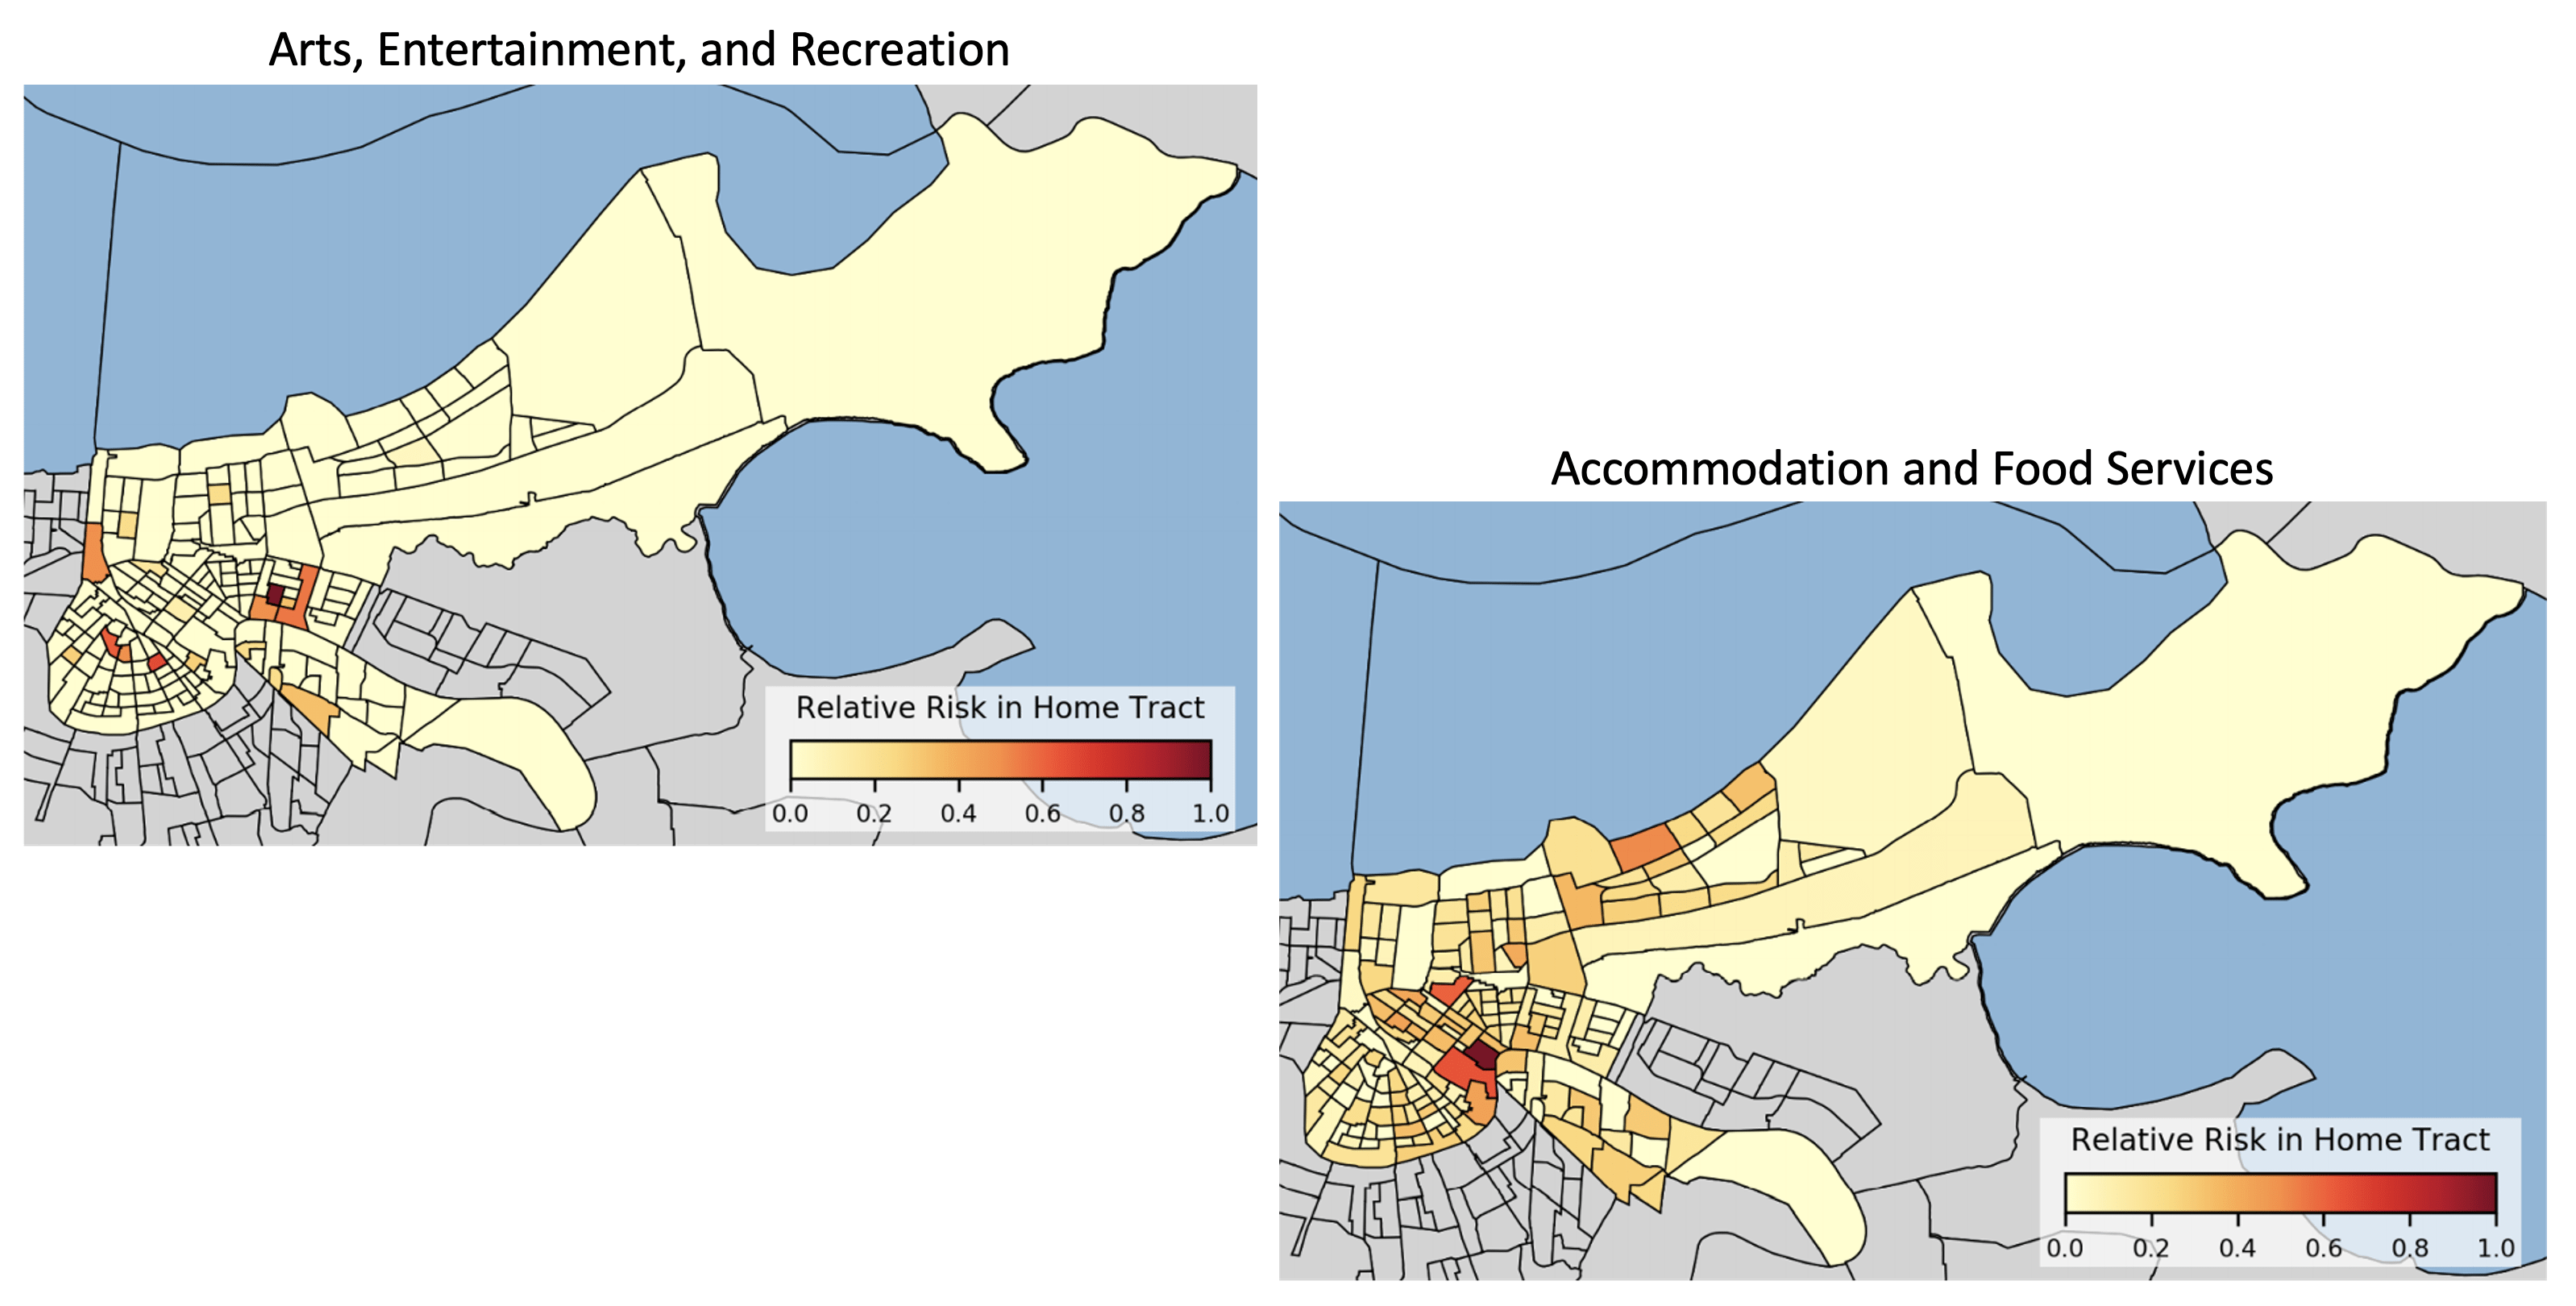
Residential risk for workers employed in the French Quarter of New Orleans. At this stage, the model has determined workplace exposure from real-time travel patterns and epidemic data, and has mapped the risk back to workers' residences.
Results
Risks from each occupational category vary greatly between tracts. As seen in the two heat maps above, the risk due to working in the French Quarter is highest for unique tracts depending on the occupational category which is being reopened. The risk taken home by workers in the arts, recreation, and entertainment industries is concentrated to a few distinct areas, while the risk taken home by workers in the accommodation and food services industries is diffused throughout the city, with some areas of more concentrated risk. Since the model framework allows for adjusting the activity levels of different economic categories, it can provide a way to test reopening scenarios and gauge the relative risk of different policies. After a collaborative development process, we have provided this model to the government of the city of New Orleans in order to help inform reopening decision-making.
Acknowledgements
Below is a list of our partners and organizations supporting our COVID-19 modeling efforts. We are grateful for financial support from NSF, NIAID, and for our collaborators at the JHU Centers for Civic Impact.