COVID-19 Content Portal
public health
Update January 31: Modeling the Spreading Risk of 2019-nCoV
By Lauren Gardner, January 31, 2020
Collaborators
This work is being led by Lauren Gardner at Johns Hopkins University CSSE, in collaboration with Aleksa Zlojutro and David Rey at rCITI at UNSW Sydney, and Ensheng Dong at JHU CSSE. At JHU, we have previously developed an interactive dashboard mapping the outbreak in real-time, and written a blog.
Model Implementation
This work builds on our previous analysis posted on January 26. We implemented a previously published model that integrates both outbreak dynamics and outbreak control into a decision-support tool for mitigating infectious disease pandemics at the onset of an outbreak through border control to evaluate the 2019-nCoV epidemic. A stochastic metapopulation epidemic simulation tool is used to simulate global outbreak dynamics, and the border control mechanism considered is passenger screening upon arrival at airports (entry screening), which is used to identify infected or at-risk individuals. A detailed description of the model is provided at the end of this section.
Our metapopulation model is based on a global network of local, city-level, populations connected by edges representing passenger air travel between cities. At each node of the network, we locally model outbreak dynamics using a discrete-time Susceptible-Exposed-Infected-Recovered (SEIR) compartmental model. IATA monthly passenger travel volumes for all travel routes connecting airport pairs (including stopovers) is used to construct the weighted edges. The SEIR parameters are defined based on a 5-day incubation period, which aligns with an estimated incubation period of 5.2 days in a recent NEJM publication. The effective contact rate in our model corresponds to a reproductive number of 2, which aligns with an estimate from Imperial College London, reporting a range between 1.5 and 3.5, and the recent NEJM publication, which estimated an average R0 of 2.2. We set the recovery period to five days. We assume initial cases of 2019-nCoV are only present in Wuhan, and no border control is accounted for. The model results presented are based on an average of 250 runs.
Results
The results presented in this analysis are based on the 100 total cases of 2019-nCoV reported outside of mainland China on January 29. Specifically, we estimate the expected number of cases in mainland China at the end of January, as well as the global distribution of the infected travelers.
We believe the actual number of 2019-nCoV cases in mainland China are likely much higher than that reported to date. Specifically, we estimate there to be around 58,000 cumulative cases of 2019-nCoV in mainland China by the end of January (as of January 31, the reported cases is close to 12,000). This estimate is in line with our previous analysis on January 25, which estimated the proportion of reported to estimated cases to be close to 10%. It is likely that part of this discrepancy is due to reporting delays. However, the substantially larger number of estimated cases suggest a majority of the cases may be mild (or asymptomatic), do not require seeking medical care, and thus are not reported. Furthermore, based on this analysis, we believe the outbreak began in November, and there were already hundreds of human cases of 2019-nCoV in Wuhan in early December. The estimated verses confirmed cases during January are presented in Figure 1.
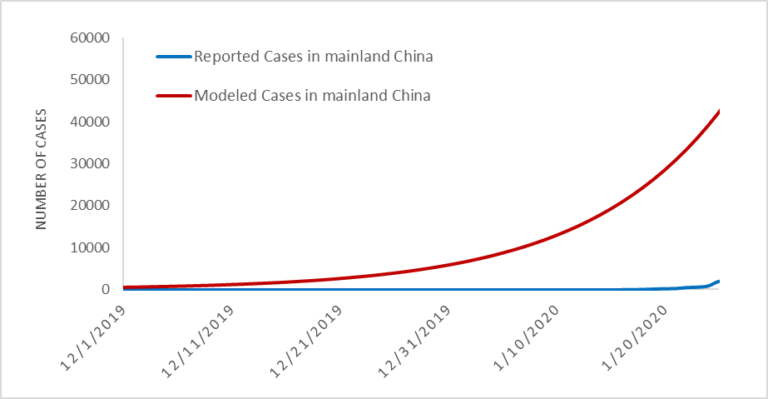
Figure 1. Estimated vs. Reported Cases of 2019-nCoV cases globally.
In addition to inferring the current outbreak size, the model provides the expected number of (the 100) imported cases arriving at each airport globally (based on final travel destinations of travelers). By aggregating this over all airports in a country/region we can estimate the total number of imported cases in each country/region. The country level importation risk is illustrated in the map in Figure 2, with the darker shades equating to higher importation risk, and the red outline indicating the set of countries reporting cases as of January 31.
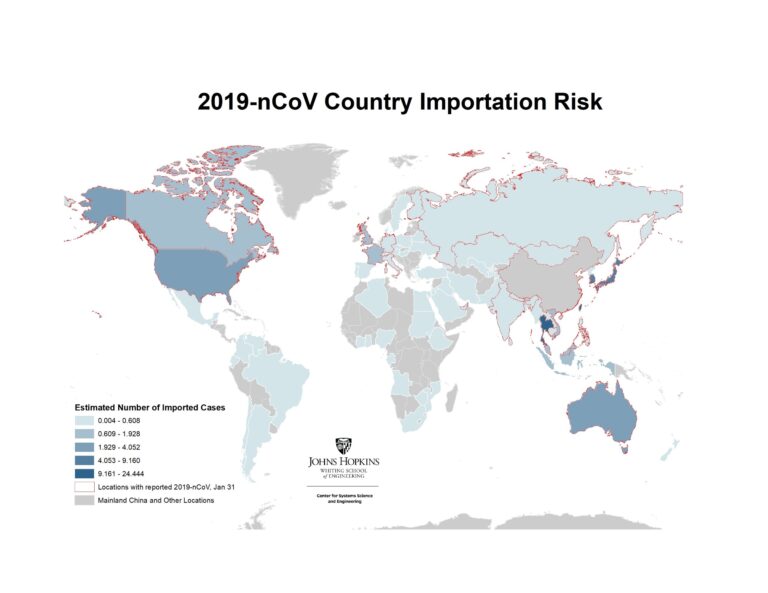
Figure 2. Heatmap of Countries/regions with highest risk of imported 2019-nCoV cases, January 31
Figure 3 below reveals how our estimated number of imported cases arriving in each country/region compared with the actual number of reported 2019-nCoV cases in each country. The simulation results align with the number of air travel reported cases outside of mainland China during the emerging stage of the epidemic. As of January 31, 24 countries excluding mainland China have reported at least one travel related case, with the list of affected countries consistent with our ranking. Some of the reported cases (represented by the orange bars) were locally acquired in their respective country/region (e.g., U.S., Germany, Japan, Vietnam), which partially explains the discrepancy with our travel related risk estimates.
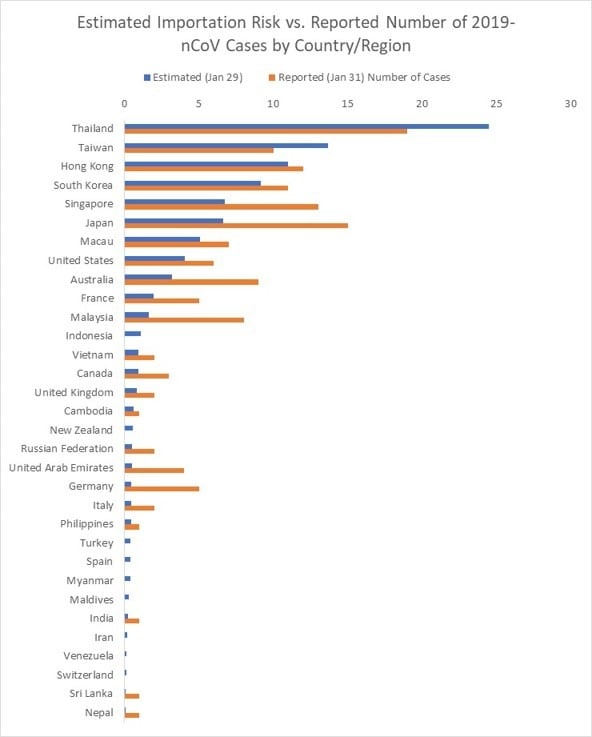
Figure 3. List of Countries/regions with estimated number of imported cases vs. reported number of 2019-nCoV cases (as of Jan 31) .
We further present the results at the airport level (based on their final travel destination), to identify the set of cities outside mainland China at highest risk of an outbreak. Figure 4 illustrates the set of cities within the U.S. at greatest risk of 2019-nCoV based on the expected number of arriving infected travelers at airports in the city, and the red outlines highlight the states that have already reported cases. The set of at-risk airports outside mainland China are illustrated in Figures 5, with the primary risk posed to southeast Asia. Only a subset of U.S. airports are listed in the top 100 globally. These results are consistent with our previous analysis on January 25. While many of these cities have already reported cases, they should be prepared for additional cases to be reported over the coming days, both in travelers whom departed Wuhan before the travel ban was implemented on January 23, and possibly through human to human transmission from infected travelers who arrived previously.
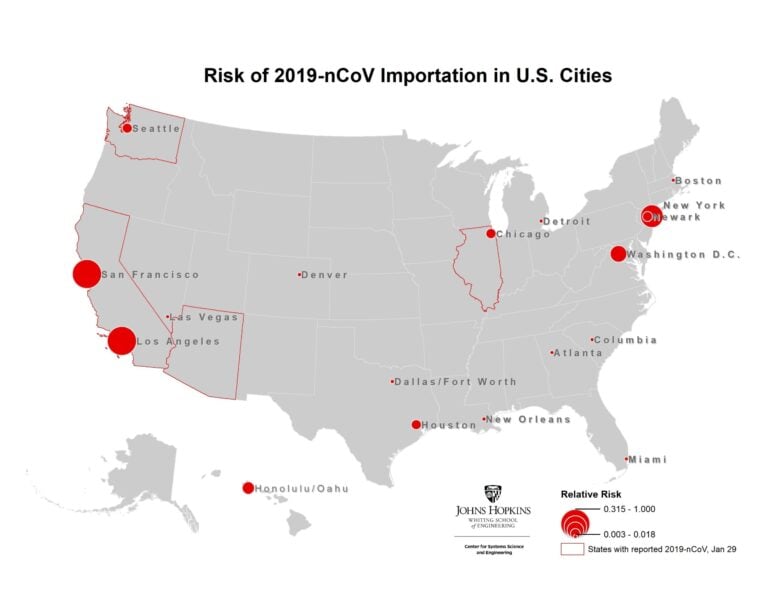
Figure 4. Map of highest risk U.S. cities based on likelihood of 2019-nCoV arriving travelers
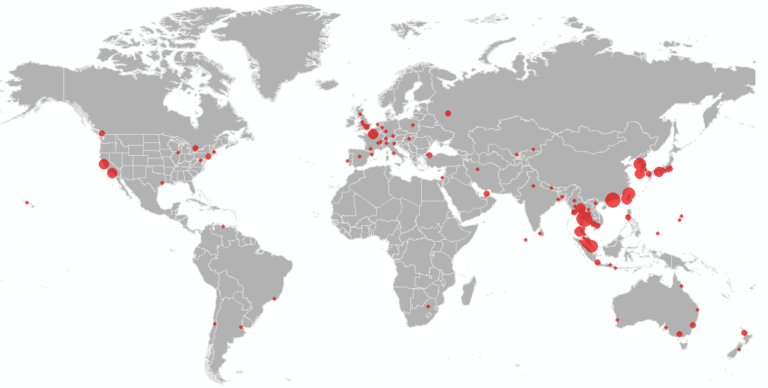
Figure 5. Map of the airports at highest risk of 2019-nCoV arriving travelers outside mainland China.
Limitations
There are multiple modeling assumptions and limitations that should be noted regarding these estimates.
- There is still uncertainty about the transmission of 2019-nCoV. The parameters for the reproductive number and incubation period chosen for this analysis align with the best estimates to date. There is less known about the duration of the recovery period, which may be longer than the five days specified in this analysis. More data will help us finer tune our estimates.
- Transmission of infection from asymptomatic individuals during the incubation period, as was recently confirmed, is not considered in this analysis. It is therefore likely the number of reported cases outside of China will increase in the coming days, especially in those cities identified to be at highest risk in this analysis.
- The model only accounts for passenger air travel, and excludes mobility within and between cities via other modes of transport. Therefore, the spreading risk between regions connected via alternatives modes of travel is underestimated. This is most applicable to spread within China, which we are underestimating.
- The SEIR parameters used to model the outbreak within each city are deterministic. However, the spread of infected travelers moving between cities is modeled stochastically.
- Arrival passenger screening at airports and the complete air travel ban implemented in Wuhan on January 23 are not accounted for in this analysis. We are therefore likely overestimating the number of cases exported out of Wuhan during the last few days of our simulation. However, this is unlikely to impact the relative ranking of the destinations.
- No local control mechanisms (prophylaxtics, vaccines, school closures, quarantine efforts) within cities are accounted for. Thus, the R0 is assumed to be constant over time, and across all locations. It is likely R0 is highly variable between locations, and lower than it was at the start of the outbreak, due to changes in individual’s behavior. Additionally, some higher R0 estimates based on the early stages of the outbreak are likely an overestimate at this point in time. For this same reason we may be overestimating the growth of the outbreak over the last week, and therefore overestimating total cases.
- We are using 2015 Travel data, because that is the most recent complete (airport-to-airport) data we had available in the lab.
References:
Zlojutro, A, Rey, D and L Gardner*. (2019) “Optimizing border control policies for global outbreak mitigation”. Scientific Reports 9:2216. DOI https://doi.org/10.1038/s41598-019-38665-w (Open Source link) https://rdcu.be/bniOs