
COVID-19 Content Portal
Throughout the COVID-19 pandemic, state and local governments have had to make critical decisions regarding the timing and logistics of lockdown measures. When making such decisions, it is important that they have detailed information regarding the risks posed to the populations they serve. For this reason, in partnership with the city of New Orleans, CSSE created a model that maps COVID-19 risk from workplaces to residences. This model estimates the risk of exposure to COVID-19 infection in each type of workplace and calculates how much risk exposed workers take home with them based on their commuting patterns and residential locations. This way, we can aggregate the risk that workers bring back to their home locations throughout the city and understand how opening various districts and job sectors will affect exposure. The model calculates the risk due to workplace exposure at the census tract level in three steps: estimating infection risk at each tract, simulating commuting patterns, and mapping risk from workplaces to residences. The resulting risk estimates are used to create a heat map of how much risk is brought home to each area of the city from each occupational category and location. Importantly, this model does not reflect overall COVID-19 risk. Instead, since policy makers must weigh health benefits of keeping people at home against the economic effects of limited business, this model focuses on the risk of exposure at work and where workers take that risk when they go home.
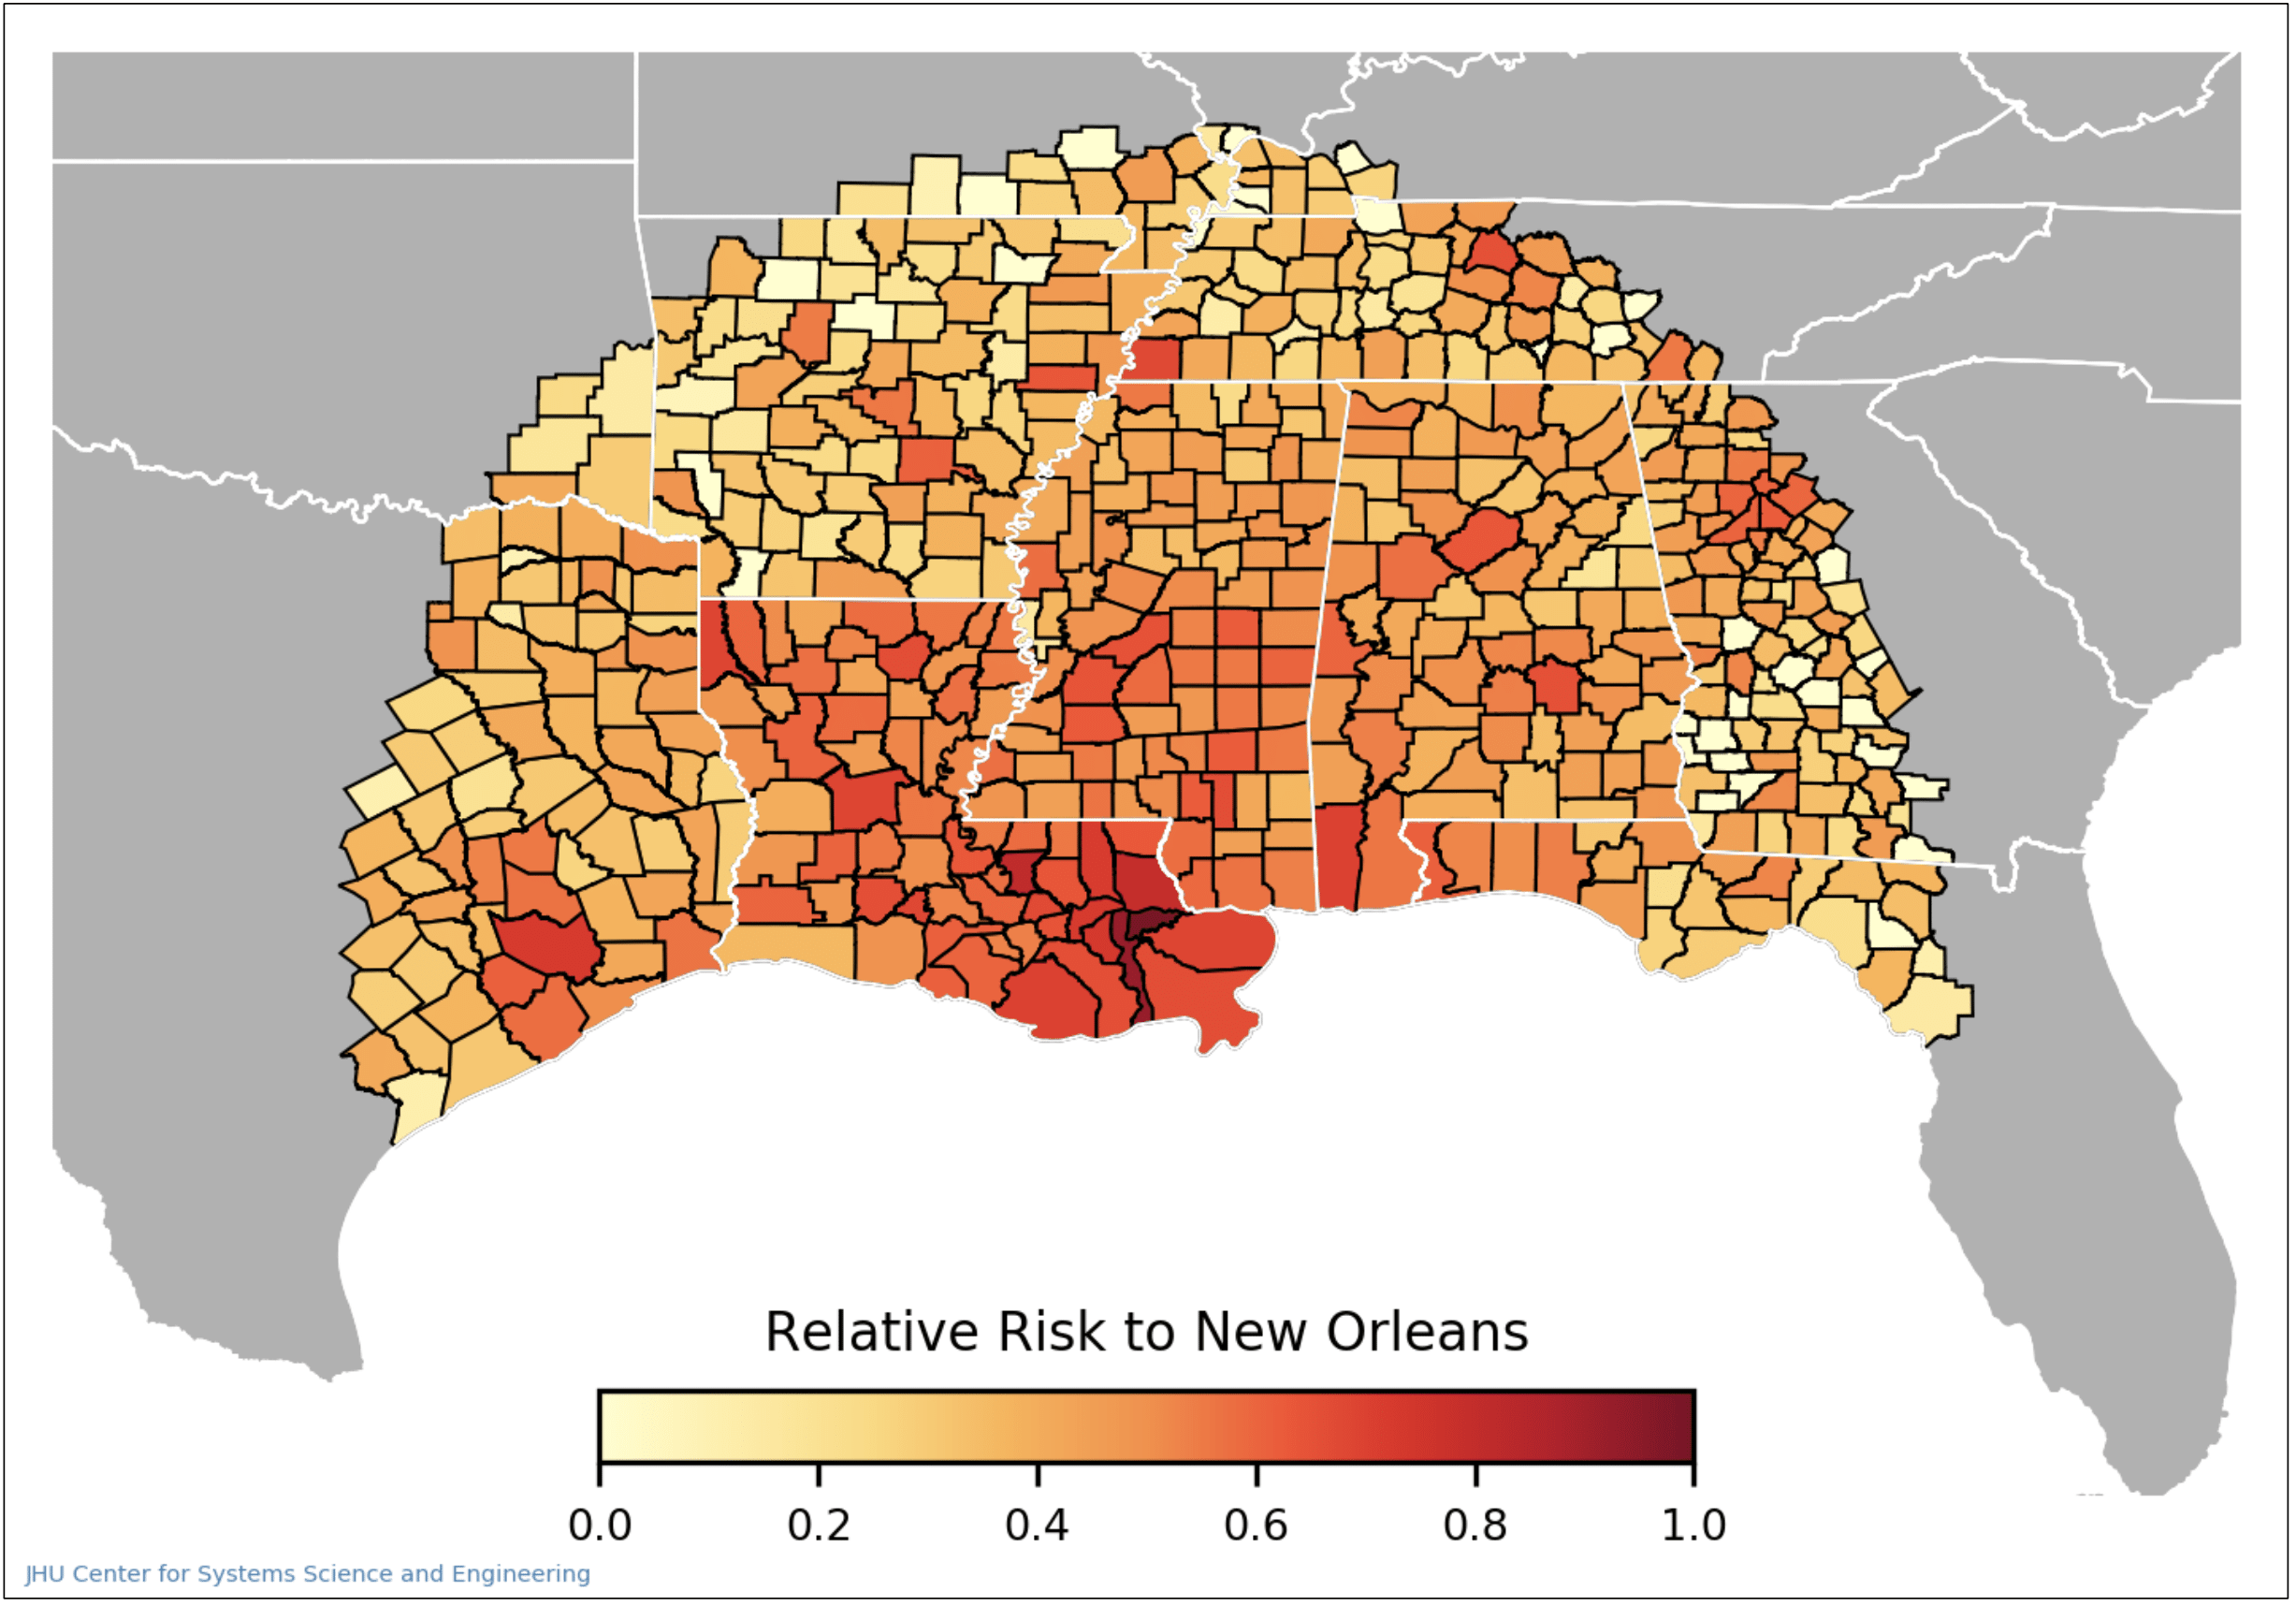
To calculate how high the risk of exposure to COVID-19 is for each tract in the city, the model calculates an estimate of how many infected people visit that tract. We estimate this using cellular phone mobility data by looking at trips to New Orleans for a multi-week span preceding the date of interest. County-level case data from the CSSE COVID-19 Dashboard is used to weigh the risk brought by each trip to New Orleans using the proportion of new cases to the population (case incidence) at the origin of the trip. The total workplace risk to a tract is the summation of the risk brought by each trip to that tract over the 14-day period being studied.
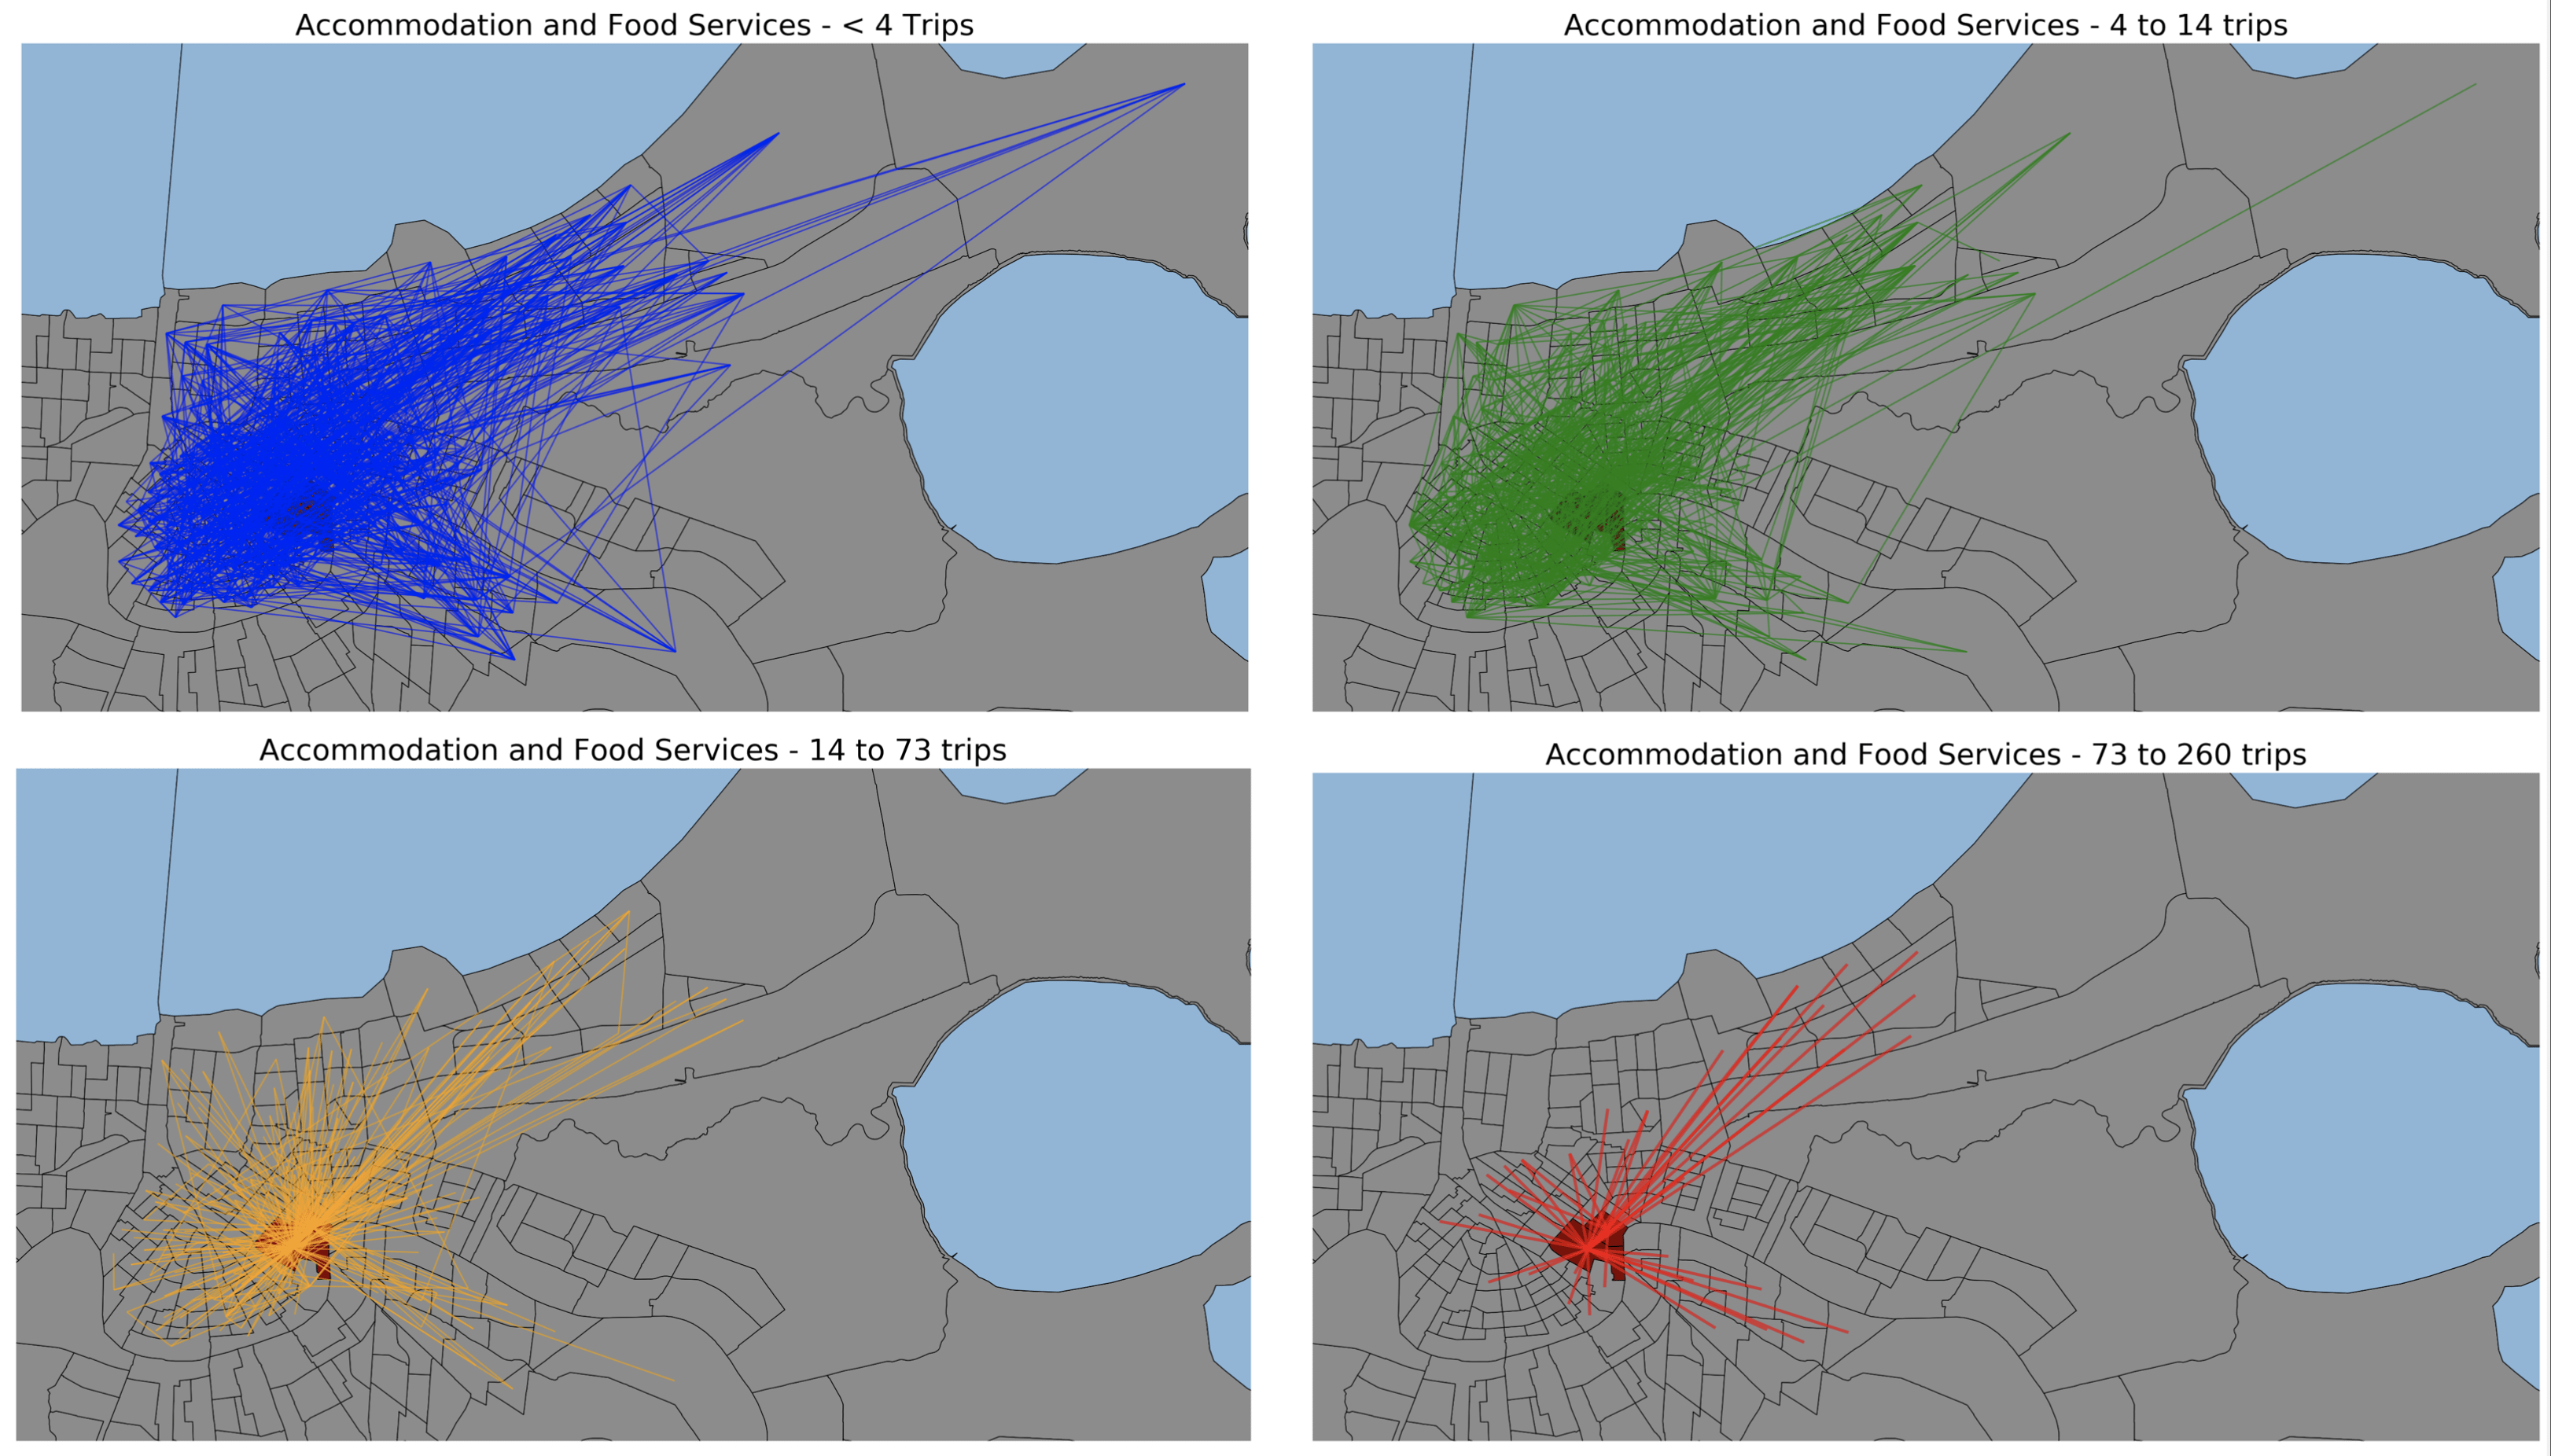
The second step of the model provides the necessary information to link exposure risk in the workplace to the risk brought home by workers. In order to make this connection, two elements must be simulated – the first is the commuting travel patterns of workers broken down by occupational category, and the second is the relative risk of infection for each category. As there are no existing datasets that comprehensively map commuting patterns with specific origin-destination linkages in New Orleans by job type, we use an optimization model to generate commuting flows by job category. The US Bureau of Labor Statistics (BLS) provides data of the number of people who work and live in each census block group, along with the job category of these residents and workers. Additionally, the BLS provides data on commuting flows between block groups but does not distinguish between the job categories of the commuters. Our optimization routine uses this data and assigns each commuting flow a job category, with an objective of minimizing the total distance traveled. The model’s occupational categorizations are constrained such that flow patterns between tracts are exactly matched. Additionally, residential and workplace totals are respected. The result of the optimization is a highly detailed set of commuter flows between tracts, broken down by occupational category.
Lastly, the model uses the results from steps one and two in order to route the risk of infection from workplaces to residences. Workplace risk, as calculated in step one, is routed back along these flow paths using the metrics from step two. It is scaled by the number of people that make the commute, the relative level of proximity to others for each occupation (proximity data provided by O*NET, the Occupational Information Network, developed under the U.S. Department of Labor), and the average household size of the residential tract. Each of these streams of risk flowing back from workplaces to residences is summed to yield the residential risk for each census tract. In this step, the model user can also input reopening levels for each occupational category to understand what the effects on risk will be. This reopening factor is used to scale the results at each tract by multiplying the risk for each occupational sector by the reopening level.
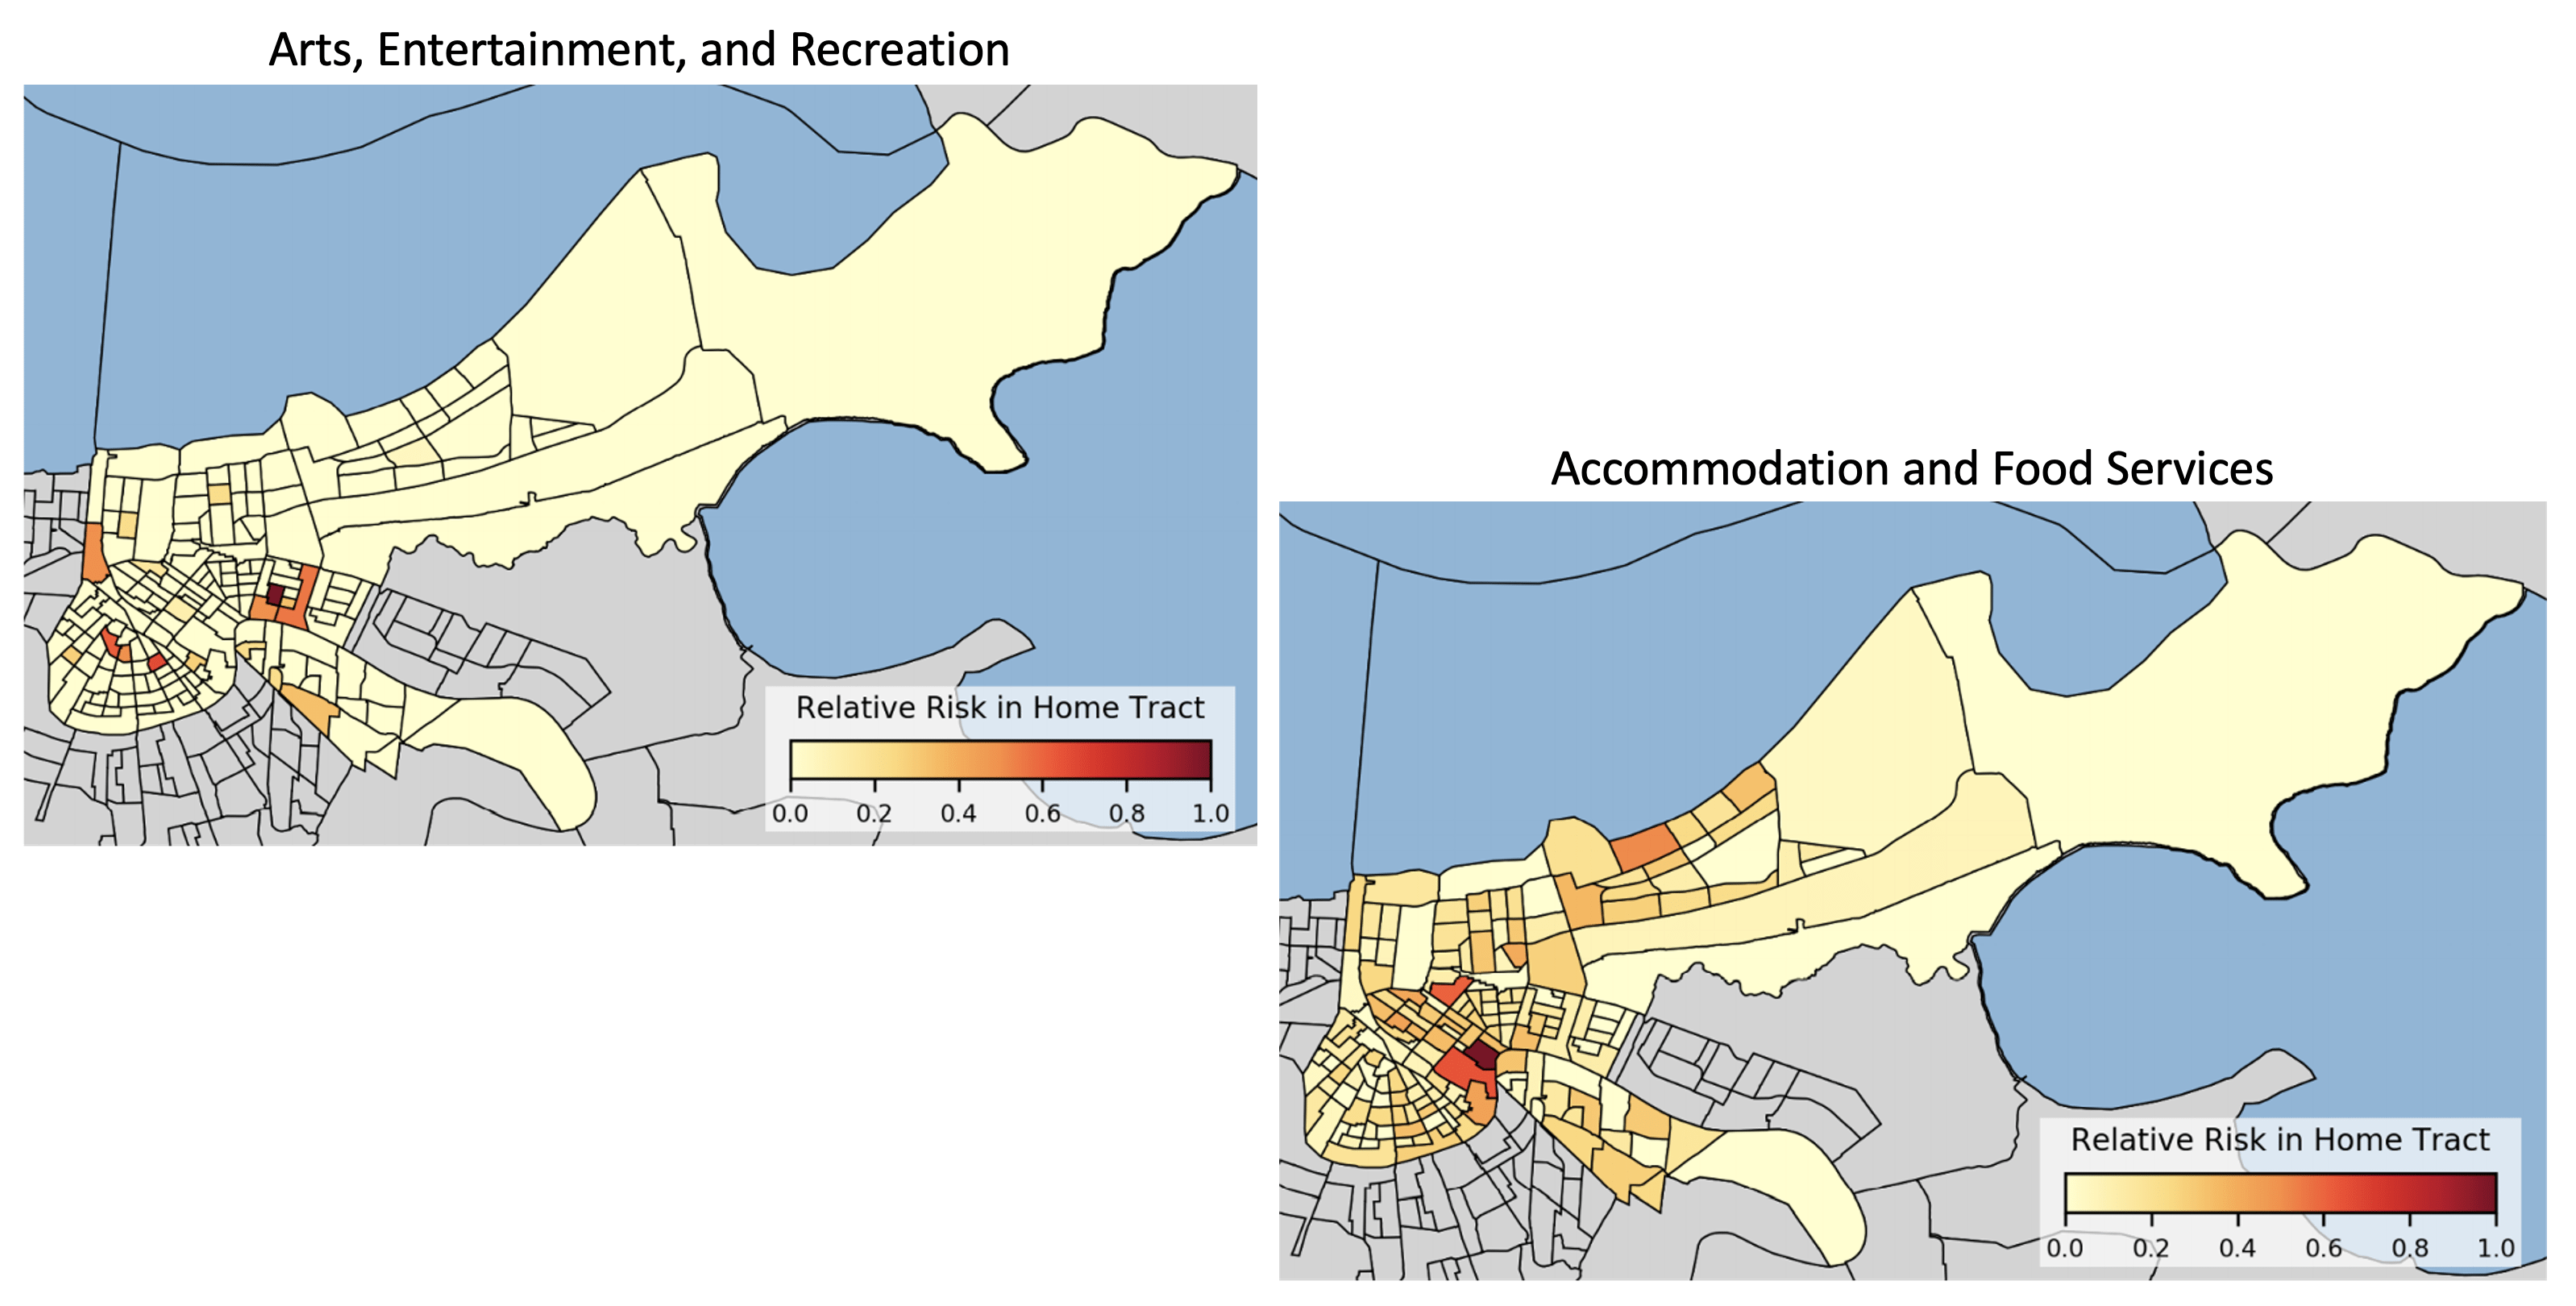
Risks from each occupational category vary greatly between tracts. As seen in the two heat maps above, the risk due to working in the French Quarter is highest for unique tracts depending on the occupational category which is being reopened. The risk taken home by workers in the arts, recreation, and entertainment industries is concentrated to a few distinct areas, while the risk taken home by workers in the accommodation and food services industries is diffused throughout the city, with some areas of more concentrated risk. Since the model framework allows for adjusting the activity levels of different economic categories, it can provide a way to test reopening scenarios and gauge the relative risk of different policies. After a collaborative development process, we have provided this model to the government of the city of New Orleans in order to help inform reopening decision-making.
Below is a list of our partners and organizations supporting our COVID-19 modeling efforts. We are grateful for financial support from NSF, NIAID, and for our collaborators at the JHU Centers for Civic Impact.
In radiation therapy with continuous dose delivery for Gamma Knife® Perfexion™, the dose is delivered while the radiation machine is in movement, as oppose to the conventional step-and-shoot approach which requires the unit to stop before any radiation is delivered. Continuous delivery can increase dose homogeneity and decrease treatment time. To design inverse plans, we first find a path inside the tumor volume, along which the radiation is delivered, and then find the beam durations and shapes using a mixed-integer programming optimization (MIP) model. The MIP model considers various machine-constraints as well as clinical guidelines and constraints.
Radiation therapy is frequently used in diagnosing patients with cancer. Currently, the planning of such treatments is typically done manually which is time-consuming and prone to human error. The new advancements in computational powers and treating units now allow for designing treatment plans automatically.
To design a high-quality treatment, we select the beams sizes, positions, and shapes using optimization models and approximation algorithms. The optimization models are designed to deliver an appropriate amount of dose to the tumor volume while simultaneously avoiding sensitive healthy tissues. In this project, we work on finding the best beam positions for the radiation focal points for Gamma Knife® Perfexion™, using quadratic programming and algorithms such as grassfire and sphere-packing.
Many outpatient facilities with expensive resources, such as infusion and imaging centers, experience surge in their patient arrival at times and are under-utilization at other times. This pattern results in patient safety concerns, patient and staff dissatisfaction, and limitation in growth, among others. Scheduling practices is found to be one of the main contributors to this problem.
We developed a real-time scheduling framework to address the problem, specifically for infusion clinics. The algorithm assumes no knowledge of future appointments and does not change past appointments. Operational constraints are taken into account, and the algorithm can offer multiple choices to patients.
We generalize this framework to a new scheduling model and analyze its performance through competitive ratio. The resource utilization of the real-time algorithm is compared with an optimal algorithm, which knows the entire future. It can be proved that the competitive ratio of the scheduling algorithm is between 3/2 and 5/3 of an optimal algorithm.
This work was performed with the MIT/MGH Collaboration.
In many healthcare services, care is provided continuously, however, the care providers, e.g., doctors and nurses, work in shifts that are discrete. Hence, hand-offs between care providers is inevitable. Hand-offs are generally thought to effect patient care, although it is often hard to quantify the effects due to reverse causal effects between patients’ duration of stay and the number of hand-off events. We use a natural randomized control experiment, induced by physicians’ schedules, in teaching general medicine teams. We employ statistical tools to show that between the two randomly assigned groups of patients, a subset who experiences hand-off experience a different length of stay compared to the other group.
This work was performed with the MIT/MGH Collaboration.
Primary care is an important piece in the healthcare system that affects the downstream medical care of patients heavily. There are specific challenges in primary care as healthcare shifts from fee-for-service to population health management and medical home, focuses on cost savings and integrates quality measures. We consider the primary care unit at a large academic center that is facing similar challenges. In this work we focus on the imbalance in workload, which is a growing regulatory burden and directly concerns any staff in primary care. It can result in missed opportunities to deliver better patient care or providing a good work-environment for the physicians and the staff. We consider the primary care unit at the large academic center and focus on their challenge in balancing staff time with quality of care through a redesign of their system. We employ optimization models to reschedule providers’ sessions to improve the patient flow, and through that, a more balanced work-level for the support staff.
This work was performed with the MIT/MGH Collaboration.
Perioperative services are one of the vital components of hospitals and any disruption in their operations can leave a downstream effect in the rest of the hospital. A large body of evidence links inefficiencies in perioperative throughput with adverse clinical outcomes. A regular delay in the operating room (OR), may lead to overcrowding in post-surgical units, and consequently, more overnight patients in the hospital. Conversely, an underutilization of OR is not only a waste of an expensive and high-demand resource, but it also means that other services who have a demand are not able to utilize OR. This mismatch in demand and utilization may, in turn, lead to hold-ups in the OR and cause further downstream utilization. We investigate the utilization of operating rooms by each service. The null hypothesis of this work is that the predicted utilization of the OR, i.e., the current block schedule, matches completely with the actual utilization of the service. We test this hypothesis for different utilization definitions, including physical and operational utilization and reject the null hypothesis. We further analyze why a mismatch may exist and how to optimize the schedule to improve patient flow in the hospital.