Measles
public health
How International Travel and Vaccine Resistance have led to a resurgence of Measles in the U.S.
This resurgence of measles cases is due to two main risk factors. The first, as previously noted by Olive et. al. and reiterated by Hotez, is a fall in vaccination rates fueled by anti-vaccination movements in both the U.S. and Europe. In the U.S. in particular there has been an upsurge of non-medical exemptions (NMEs) in the 18 states which allow it. Compounding the decrease in vaccination rates is the increase in international travel into these localities (where measles is supposed to have been eliminated through vaccination) from regions where measles remains endemic, and outbreaks are ongoing. The fact that measles is a highly contagious virus capable of airborne spread further increases the seriousness of this threat.
Olive et al. previously presented a “heat map” of measles risk based on NMEs for vaccination in U.S. counties. In collaboration with Sahotra Sarkar at UT Austin and others (Aleksa Zlojutro at UNSW Sydney and Kamran Khan at University of Toronto), we further investigated how this “heat map” of measles risk in the US might shift geographically when county level NME rates (that reveal pockets of low vaccination) were compounded with incoming international air travel volume weighted by the size of measles outbreaks abroad.
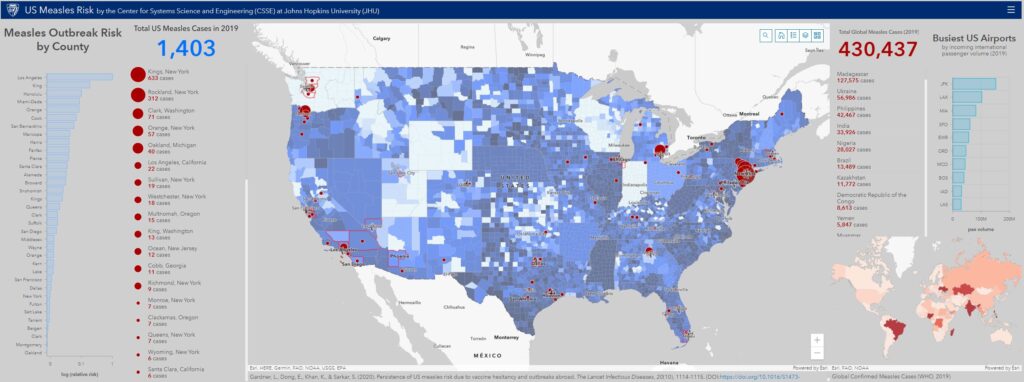
To do so, we performed an analysis that compounds four factors: 1) international air travel volume arriving from measles affected countries into each U.S. county, 2) county NME rates, 3) county population, and 4) the size (incidence rate) of the measles outbreak at travel origin country. The analysis was conducted for each year between 2011 and 2019. The detailed methods and results of the analysis are soon to be published in Lancet Infectious Diseases. An interactive map illustrating the results of our analysis and corresponding data is available here. Additionally, the figures below illustrate the U.S. measles risk for 2019 computed by the model, and the corresponding global level measles outbreak data from WHO. (NOTE: the 2019 analysis uses WHO reported cases from each country up to April 19.)
Results from the 2019 analysis reveal the U.S. counties at highest risk of a measles outbreak at present, and are spatially consistent with the U.S. measles cases reported to date (April 19): either the counties we identify or those immediately adjacent to them are the ones that have reported measles cases.
Critically, the results correctly predict the areas in Washington, Oregon, and New York that have seen major measles outbreaks. The risk analysis also reveals U.S. localities that have not experienced a measles outbreak in 2019 but are at risk of imported measles cases resulting in a local outbreak because they lie adjacent to a county that has and/or is served by a major international airport. These include Travis (TX), Maricopa (AZ), Clayton (GA), Honolulu County (HI), Wayne (MI), Salt Lake (UT), Hennepin (MN), Suffolk (MA), Loudon (VA), San Diego (CA) and multiple counties in Florida. Additional surveillance should also target Cook (IL) and Los Angeles (CA), which have seen only one case so far, but due to the presence of major international airports, they may serve as the fulcrum of continuous importation of measles into the United States.
Lastly, this analysis also reveals the set of countries that contribute most to measles risk across the U.S. in 2019. The top countries ordered by risk posed are: Ukraine, Mexico, Cuba, Israel, Japan, Thailand and Philippines. Therefore, we recommend that surveillance should also be directed towards those U.S. counties with the high incoming passenger volume from these countries, which should themselves be targeted for vaccination efforts. Prof. Sarkar suggests additional actions for prevention in his blog.
For further information please see our publication in Lancet Infectious Diseases (Published Online May 9, 2019).
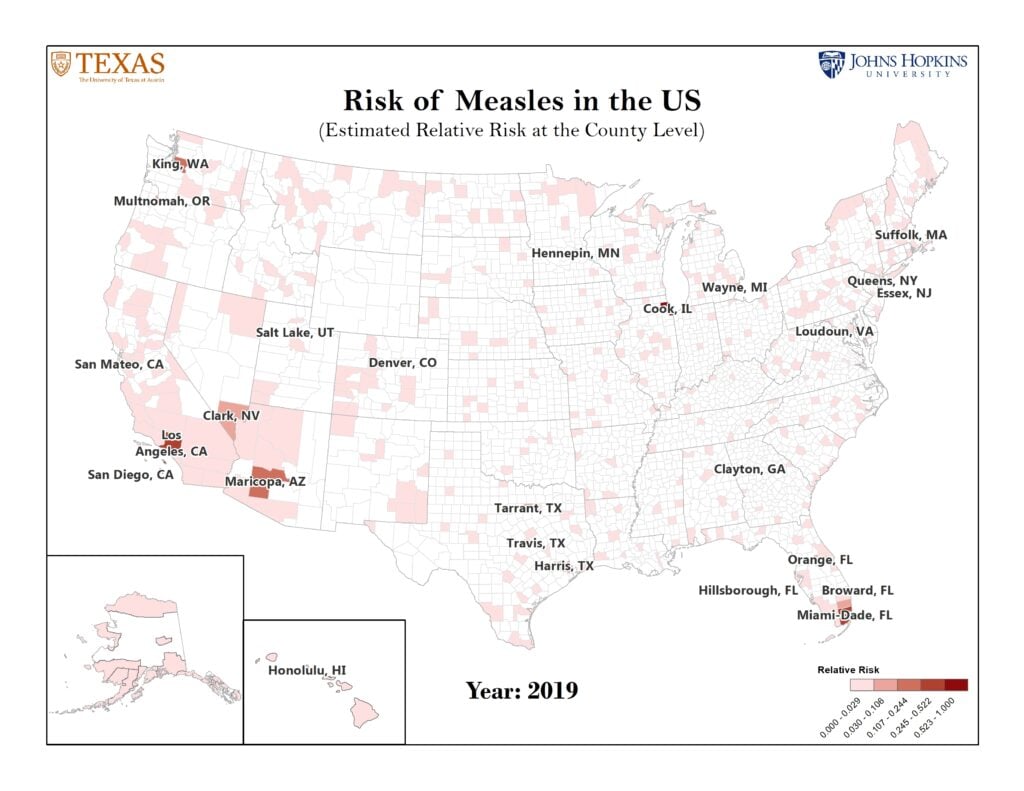
Figure 1: Top 25 U.S. Counties Predicted to be at Highest Risk for Measles in 2019.
This results in this figure correspond to our publication in Lancet Infectious Diseases (Published Online May 9, 2019). Risk is measured by the expected relative size of a measles outbreak in a county.
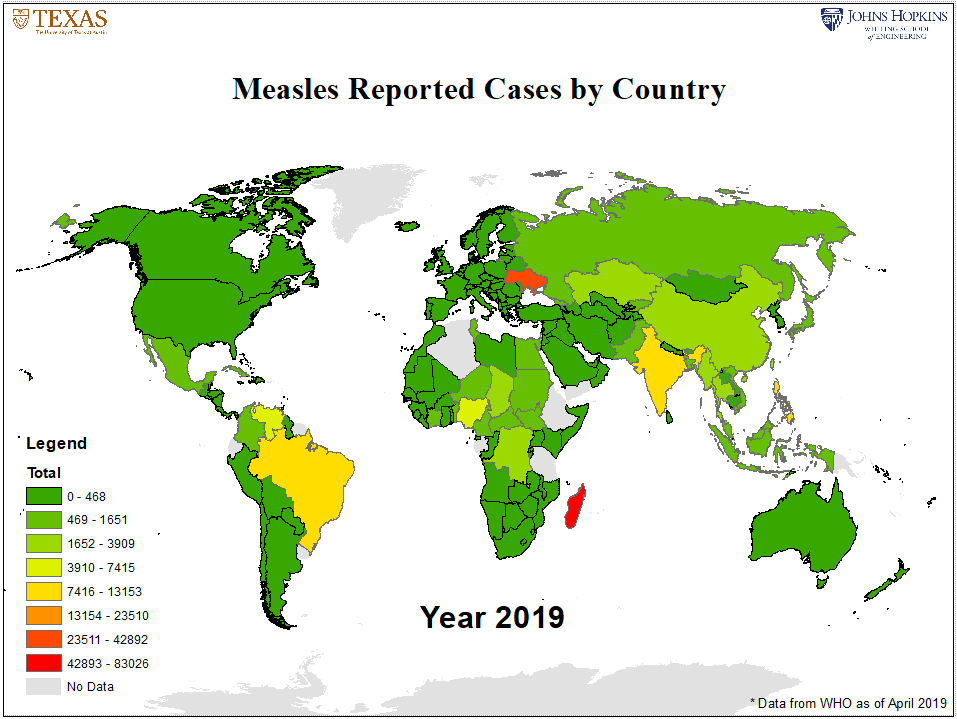
Figure 2: Annual Measles Cases by Country as reported by WHO
public health
Media Response
WLRN Podcast
List of reports
- HHS 2019 NVAC Meeting;
- Alejandra Martinez and Chris Remington in WLRN;
- Deepa Bharath in Los Angeles Daily News;
- Soumya Karlamangla in Los Angeles Times;
- NBC Los Angeles;
- Mario Ramirez in Fox 11;
- Susan Perry in MinnPost;
- Stephanie Soucheray in CIDRAP;
- Ashley P. Taylor in TheScientist;
- Jean Dubail in Patch;
- Akshay Pai in MEAWW;
- Infection Control Today;
- KFI AM 640;
- Scitech Europa;
- Herald&Review;
- Richard Franki in CHEST Physician;
- McKenzie Jean-Philippe in Oprah Magazine;
- Rachel Griess in UT News;
- Chanapa Tantibanchachai in JHU Hub;
- Helena Oliviero in Atlanta Journal-Constitution;
- Nicole Villalpando in Austin American-Statesman;
- Sinead Baker in Business Insider;
- Checkup News;
- Kate Douglas in The Chicago Tribune;
- Rich Miller in Capitol Fax;
- Tracy Connor in Daily Beast;
- Ed Cara in Gizmodo;
- Kristen Dalli in Consumer Affairs;
sElected links
- Michael Nedelman in CNN;
- Hawaii News Now;
- Todd Ackerman in Houston Chronicle;
- IFL Science;
- Alex Matthews-King in Independent;
- Emma Betuel in inverse.com;
- Journal-Gazette Times Courier;
- Andy Jechow in KUT (Austin NPR);
- KTLA 5 (Los Angeles);
- KXAN (Austin)
- Drew Knight in kvue.com (ABC affiliate);
- Rafi Letzter in Live Science;
- Soumya Karlamana in Los Angeles Times;
- Molly Walker in MedPage Today;
- Jared Gilmour in Miami Herald;
- Jerry Iannelli in Miami New Times;
- Don McNeil in New York Times;
- News Channel 8 (Tampa);
- News Wise;
- Naseem Miller in Orlando Sentinel;
- Tony Cantu in Patch Downtown Austin;
- Physician’s Briefing;
- Jared Gilmour in Sacramento Bee;
- Erin Allday in San Francisco Chronicle;
- San Gabriel Valley Tribune;
- Mike McRae in Science Alert;
- Science Daily;
- Caitlin Johnston in Tampa Bay Times;
- Robert Preidt in U.S. News and World Report;
- Gaby Galvin in U.S. News and World Report;
- Robert Preidt in WebMD.